I’ve been keeping busy and continuing to work through a lot of the projects I’ve been doing this summer! I also went to explore some new places and met some super awesome people.
In this blog I am stretched across the entire forest, and even most of the state of Washington! I worked as far north as Canada, swam in a lake south of Mount Rainier, and even went to the state capitol!
- How do I know what trees I need to measure?
- Approving Corridors
- Checking the Loggers
- Mapping and Laying-Out a Timber Sale
- Olympia
- Visiting Packwood Lake
- Dancing and Festivals
How do I know what trees I need to measure?
Yet another entry into the Carbon River Stand Exam Saga!
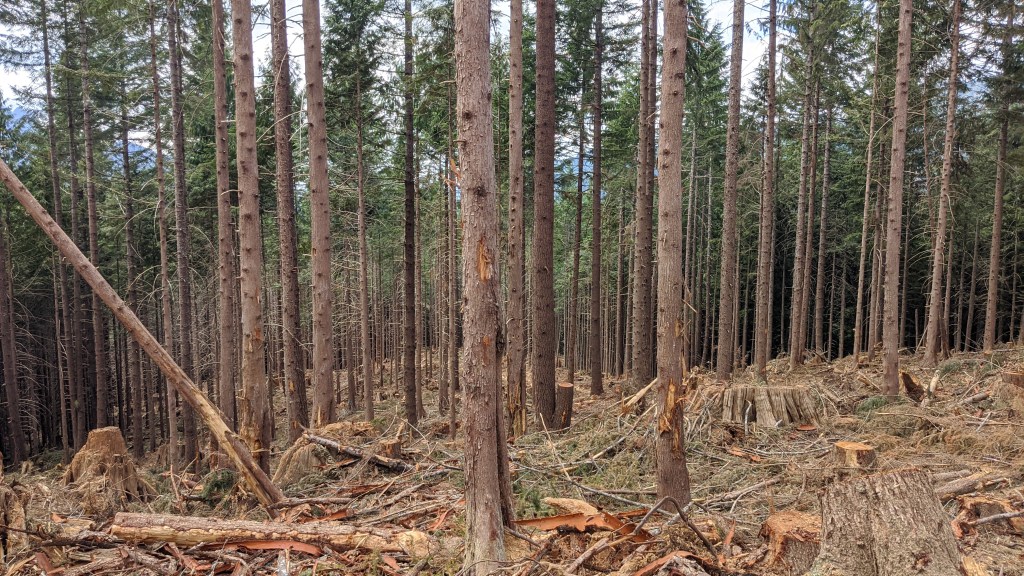
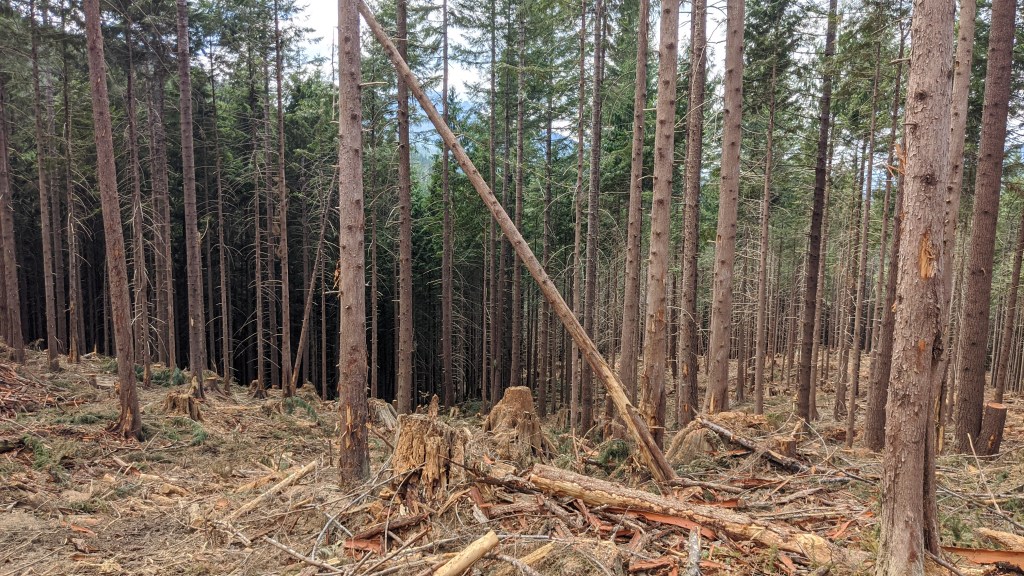
I went out a few weeks ago to measure more trees and to check the plots of the contractors that are out there doing the bulk of the measurements for the Forest Service while we focus on other things.
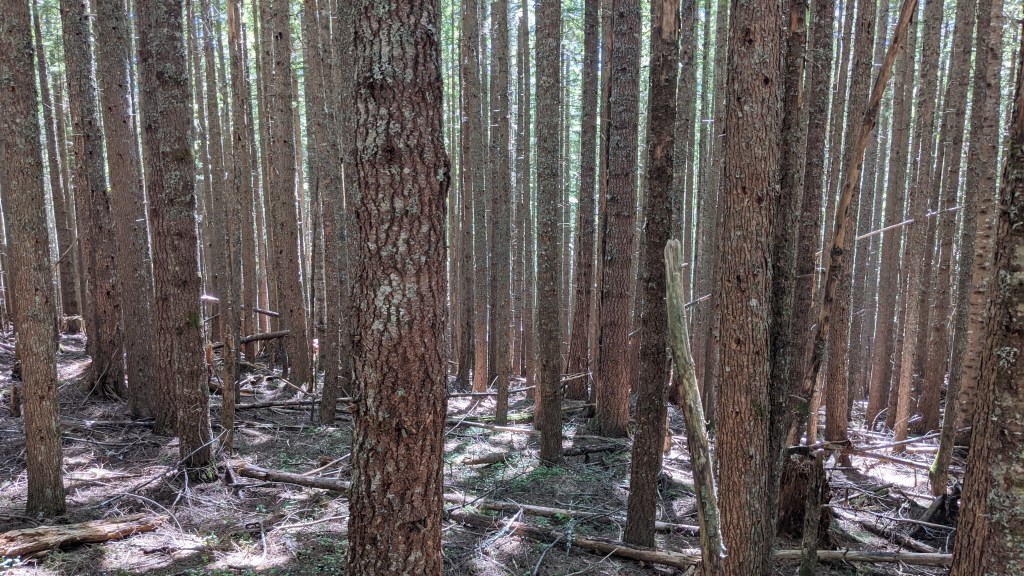
I realized while I was doing that that I didn’t really explain how I know which trees I need to measure. Because there is a correct answer, which can change depending on the method you use and what your objectives are! Looking at the photo above might be overwhelming, especially when the trees are in this phase of stand-development. There are a lot of trunks in this image! But no need to fear, we have forest measurements on our side to help us make choices.
There are lots of different ways to determine which trees you have to measure but I’m only going to talk about 3, and really only go in-depth into 2. Those methods are: census counting, fixed-radius plots, and variable-radius plots.
Census Counting
Just like with a regular census where each person gets counted, in a census count, every tree in the area you want to survey gets counted. This is normally only done with smaller plots of land where there aren’t a lot of trees to begin with. Each tree gets a number and you collect the data you need from each one.
Fixed-Radius Plots
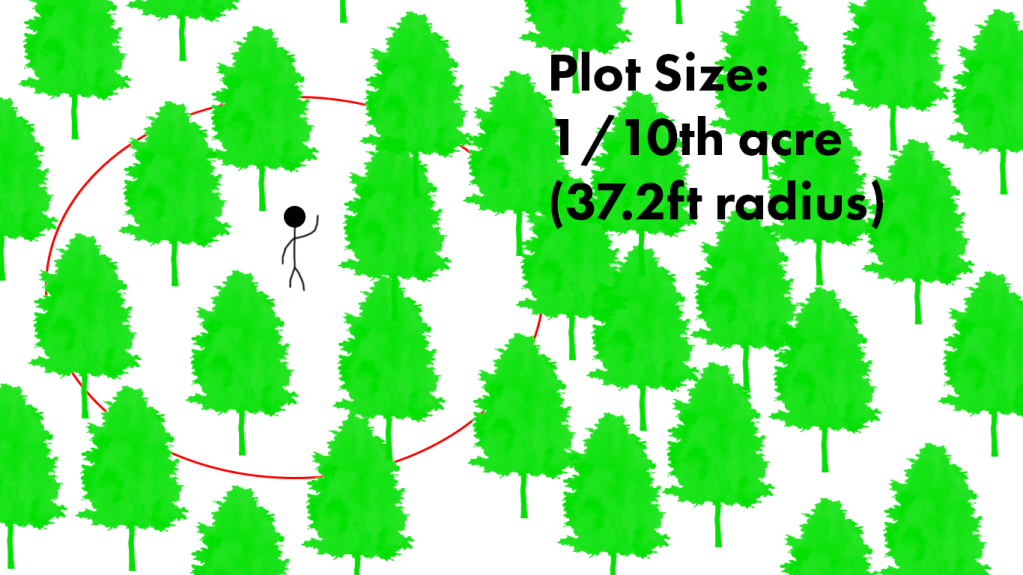
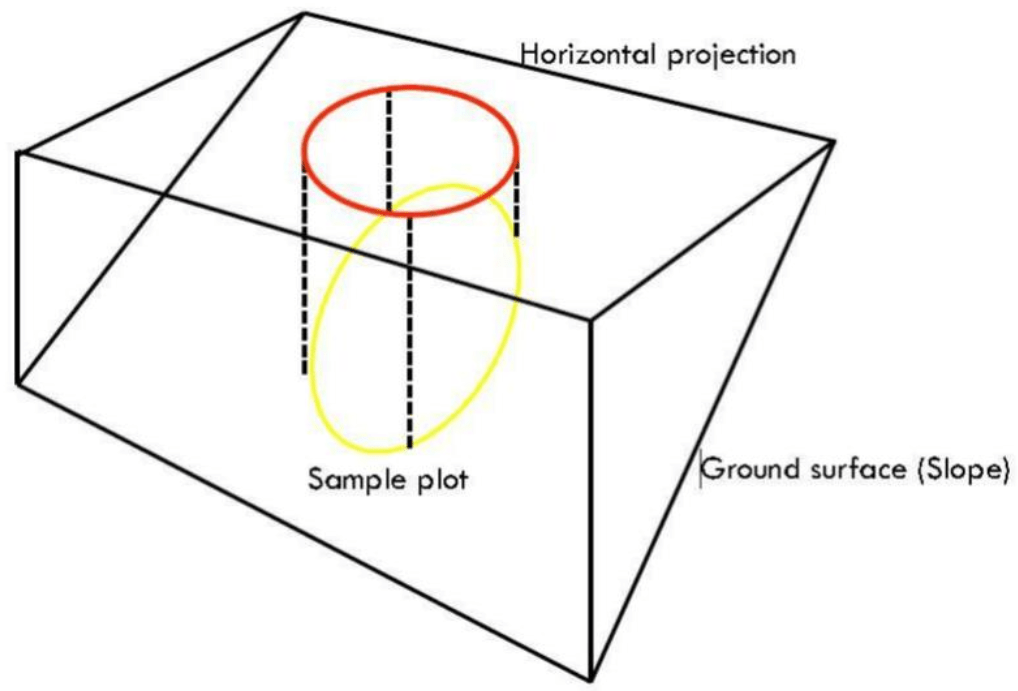
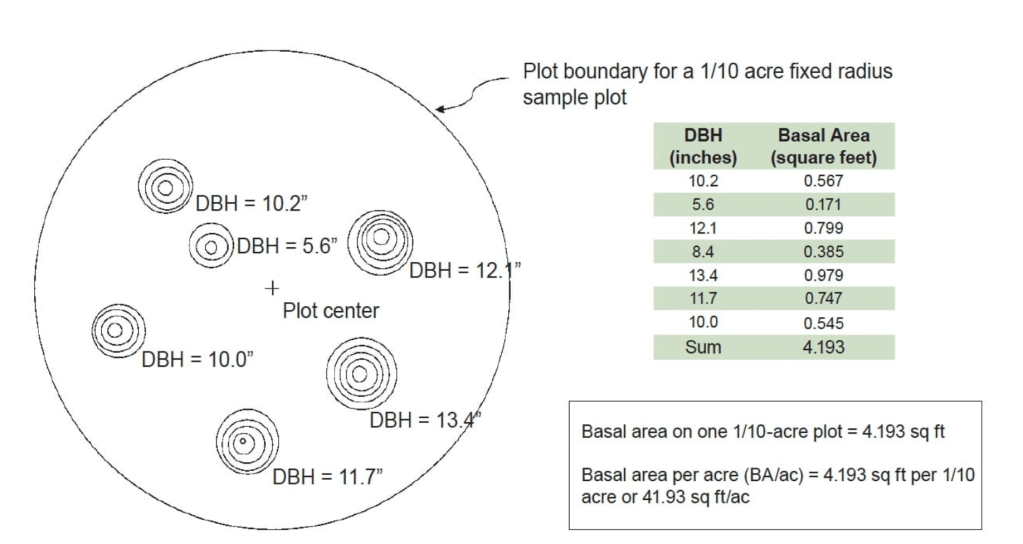
Fixed-radius plots are also pretty straight forward. First you need to pick an area you want your plot to represent (common areas are 1/10th acre, 1/50th acre, 1/100th acre, etc.). From there you use a measuring tape to walk to the appropriate radius that would represent that amount of area. You would also need to correct for any slope in that area since slope can warp the size of the circle you want to measure. In the end on a slope you’ll be measuring a wonky oval in order to get the desired area you want to capture.
From there, it’s pretty straight-forward. Any tree that is in the radius you determined is considered a measure tree and information is collected from each of them.
Variable-Radius Plots
The Alabama Forestry Extension Office has a fantastic article explaining the pros and cons of variable-radius plots, and explains in detail the math behind the concept. So if I muddy things up in this post, check out what they have to say! They also talk about using prisms, and I will talk about using the Relaskop, which are two different means to the same destination, with their own benefits and drawbacks.
The first concept to understand is basal area, which is also explained very thoroughly by the Alabama Forestry Extension Office. They did such a good job I am going to be using some of their diagrams for my little TL;DR on this blog.
Basal area is just another quantifier we can use to describe a stand of trees to another forester and it can be used to determine how dense the stand is when used in conjunction with other measurements.
It’s the total area in square feet of the cross section of all of the trees in a stand at 4.5′ from the ground. In the article I mentioned above, they say to imagine that every tree has been cut at 4.5′ from the ground and all you can see are stumps. The basal area is the area in square feet that those stumps take up.
There are lots of fancy equations that can convert DBH (diameter at breast height – 4.5 feet) to square feet. I won’t talk about them here- just now that there is a way they get converted.
Let’s say we use the 1/10th acre plot example from above and we measure the diameter of every tree within our radius. We’ll end up with the left column of the table above and we can use that information to calculate the basal area of the plot, and expand it to the stand.
Measuring out that plot is a lot of work though! If we wanted to survey a group of trees and didn’t want to have to go around with a measuring tape to determine if each tree was in or out, one way we could do that is by using a variable-radius sampling method. This way we can determine, using the power of optics and angles, which trees need to be surveyed and which don’t.
In the east we use a tool called a prism to determine this. The prism is just a piece of glass or plastic that is optically “tuned” to a certain basal area factor, which affects how many trees we count in each plot.
In the west, we use a tool called a relaskop that has an adjustable basal area factor and accounts for slope automatically. It can also measure a myriad of other things which I won’t get into in this post.
The unit we use to determine how many trees we want to be in our plot is BAF or Basal Area Factor. This number can range from as low as 5 to as high as 80 or even 90. Lower numbers include more trees and higher numbers include fewer trees in the plot. So a BAF of 5 would include a lot more of the stand than a BAF of 60.
Think of BAF as a tally approximation. Every tree that is considered in the plot is contributing 10 square feet of basal area to the plot.
If I find 10 trees that are in, the plot has 100 square feet of basal area using 10 BAF.
In the Pacific Northwest we use anywhere from 33-40 BAF because of our stand density, but in Kentucky we use 10 BAF. In some areas like the south, they go as low as 5 BAF due to their stands not being very dense.
I, again, encourage you to read the Alabama article for a more thorough explanation.
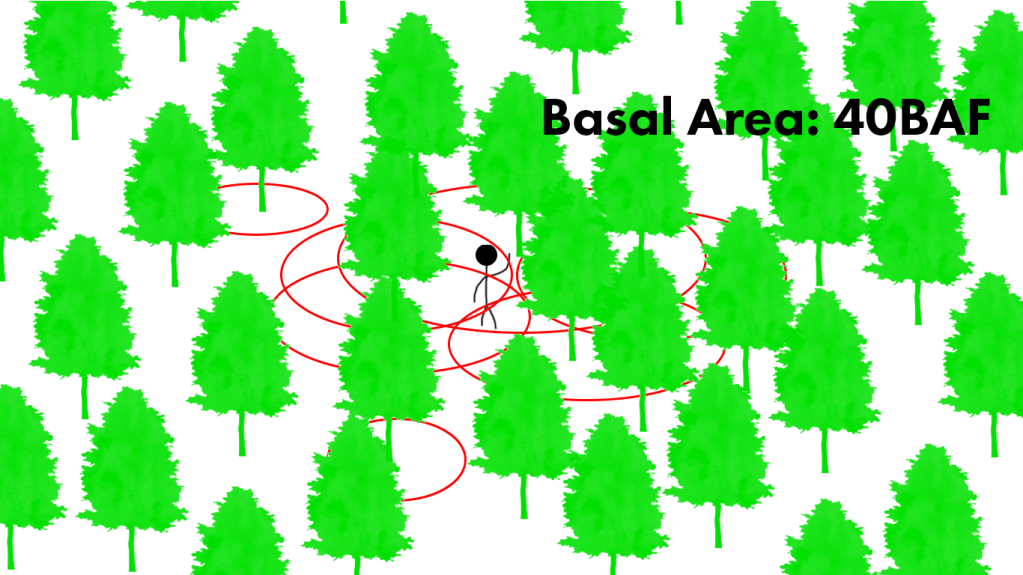
The way I like to imagine variable plots is to think of every tree as having a circle around it correlated with its diameter that can increase and decrease in size depending on the BAF. With smaller BAFs like 5 and 10, the circle is really large and it’s very easy for a tree to be in your plot, especially small trees. As the BAF increases, only very large trees and small trees close to you will be counted as in on your plot. So instead of having to measure 15 trees, you may only need to measure 5 or 6 trees and can extrapolate from those data points.
I understand this is all a bit confusing and can easily go over people’s heads but that’s the gist of it. If you have any questions feel free to ask in the comments below. It’s a lot easier to explain when you have someone in the woods and the tools are right in front of them!
That’s great, but did you see anything cool?
I did actually! Thank you for asking.
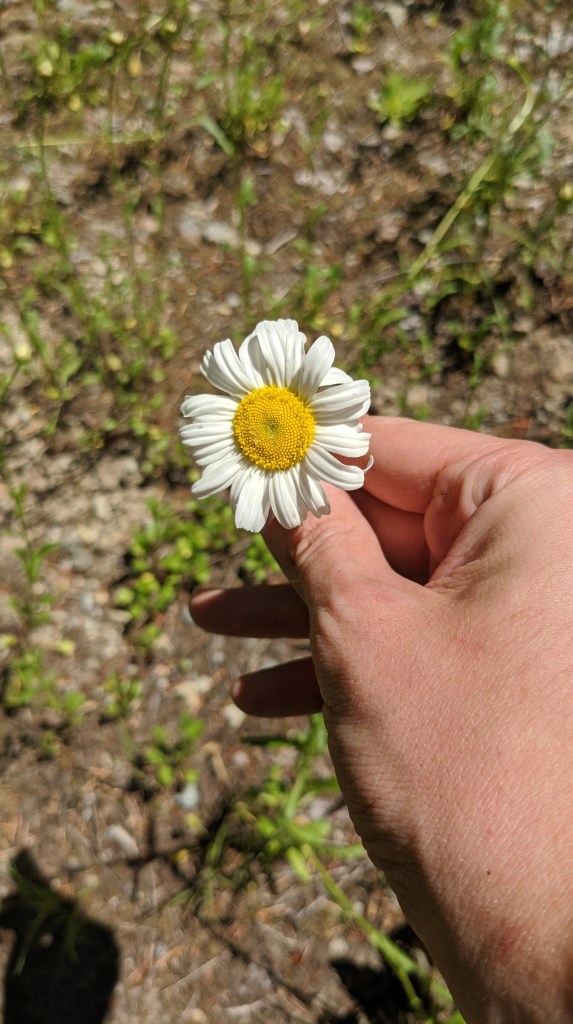
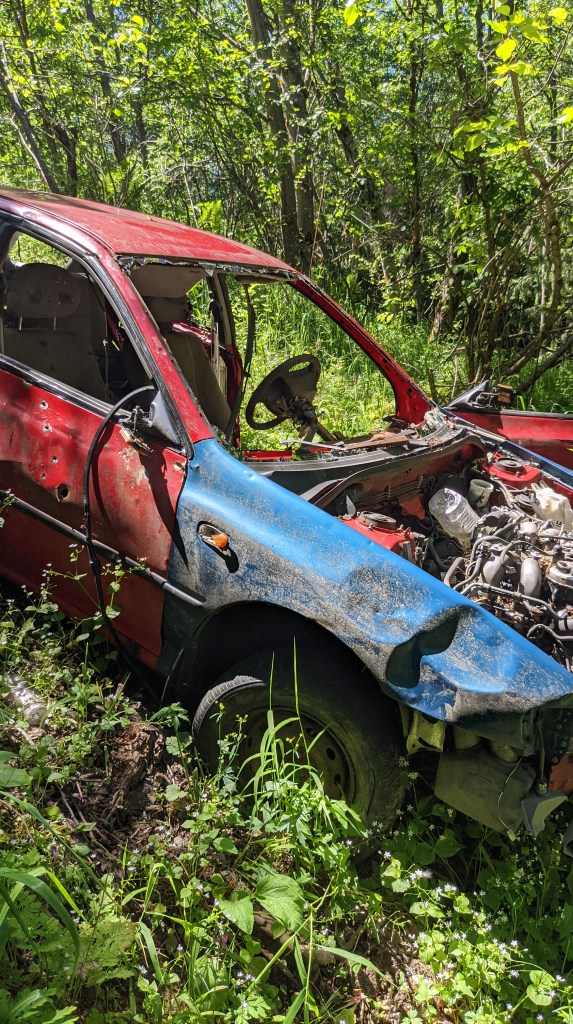
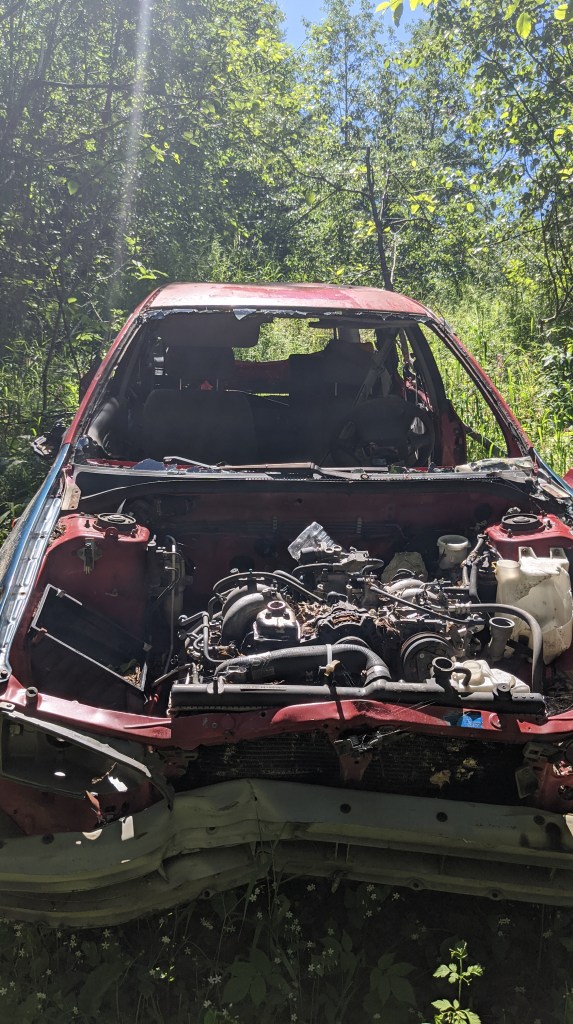
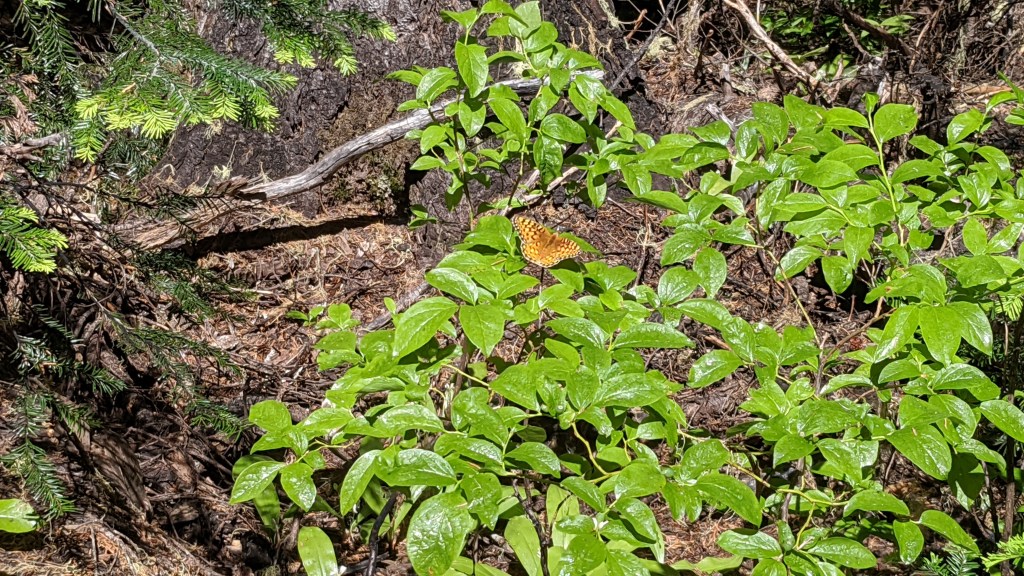
A lot of flowers were in bloom and I found an abandoned car near one of the plots I did that looked fairly fresh (it ended up here probably within the past 10 years).
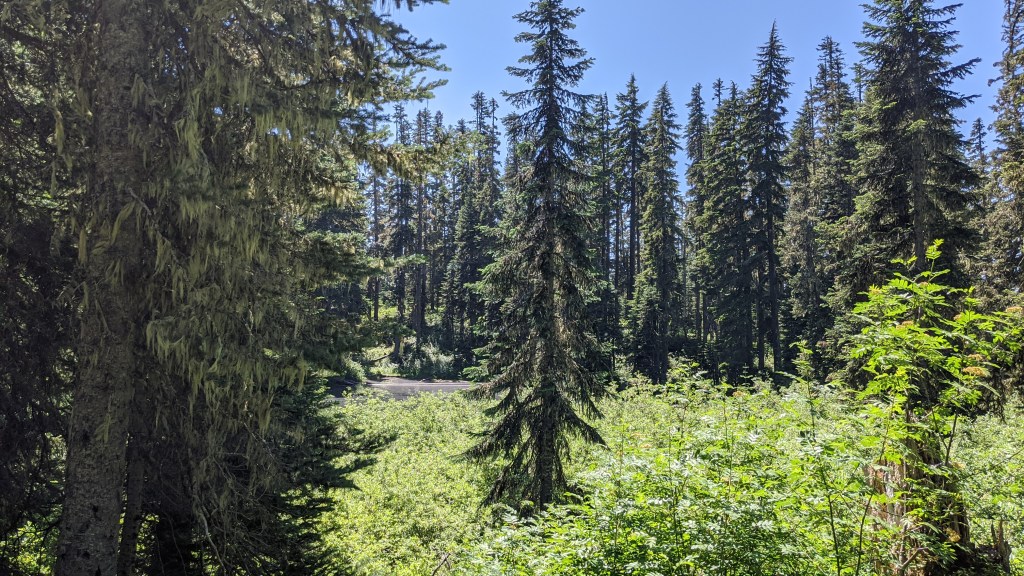
I saw a lot of dense trees and I listened to a lot of audio books during that time. I actually finished listening to Crossings by Ben Goldfarb, which I enjoyed a lot and learned a lot from!
Approving Corridors
I was back working with Sale Administration this week near Verlot! I don’t think I got any photos of the paint on the trees while I was doing corridors, so if you’re curious about what that looks like you should check out my previous post where I talk about it in more detail!
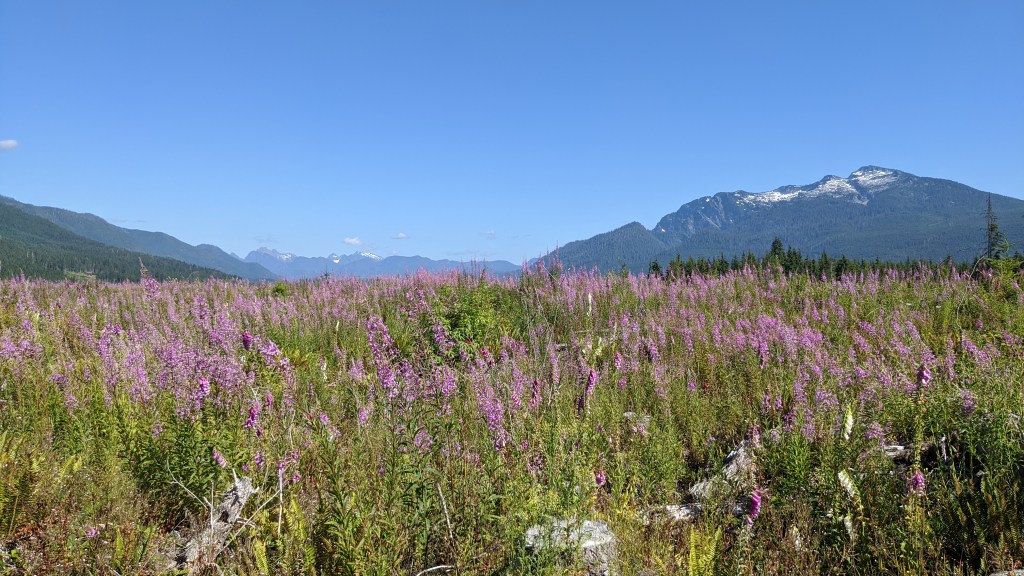
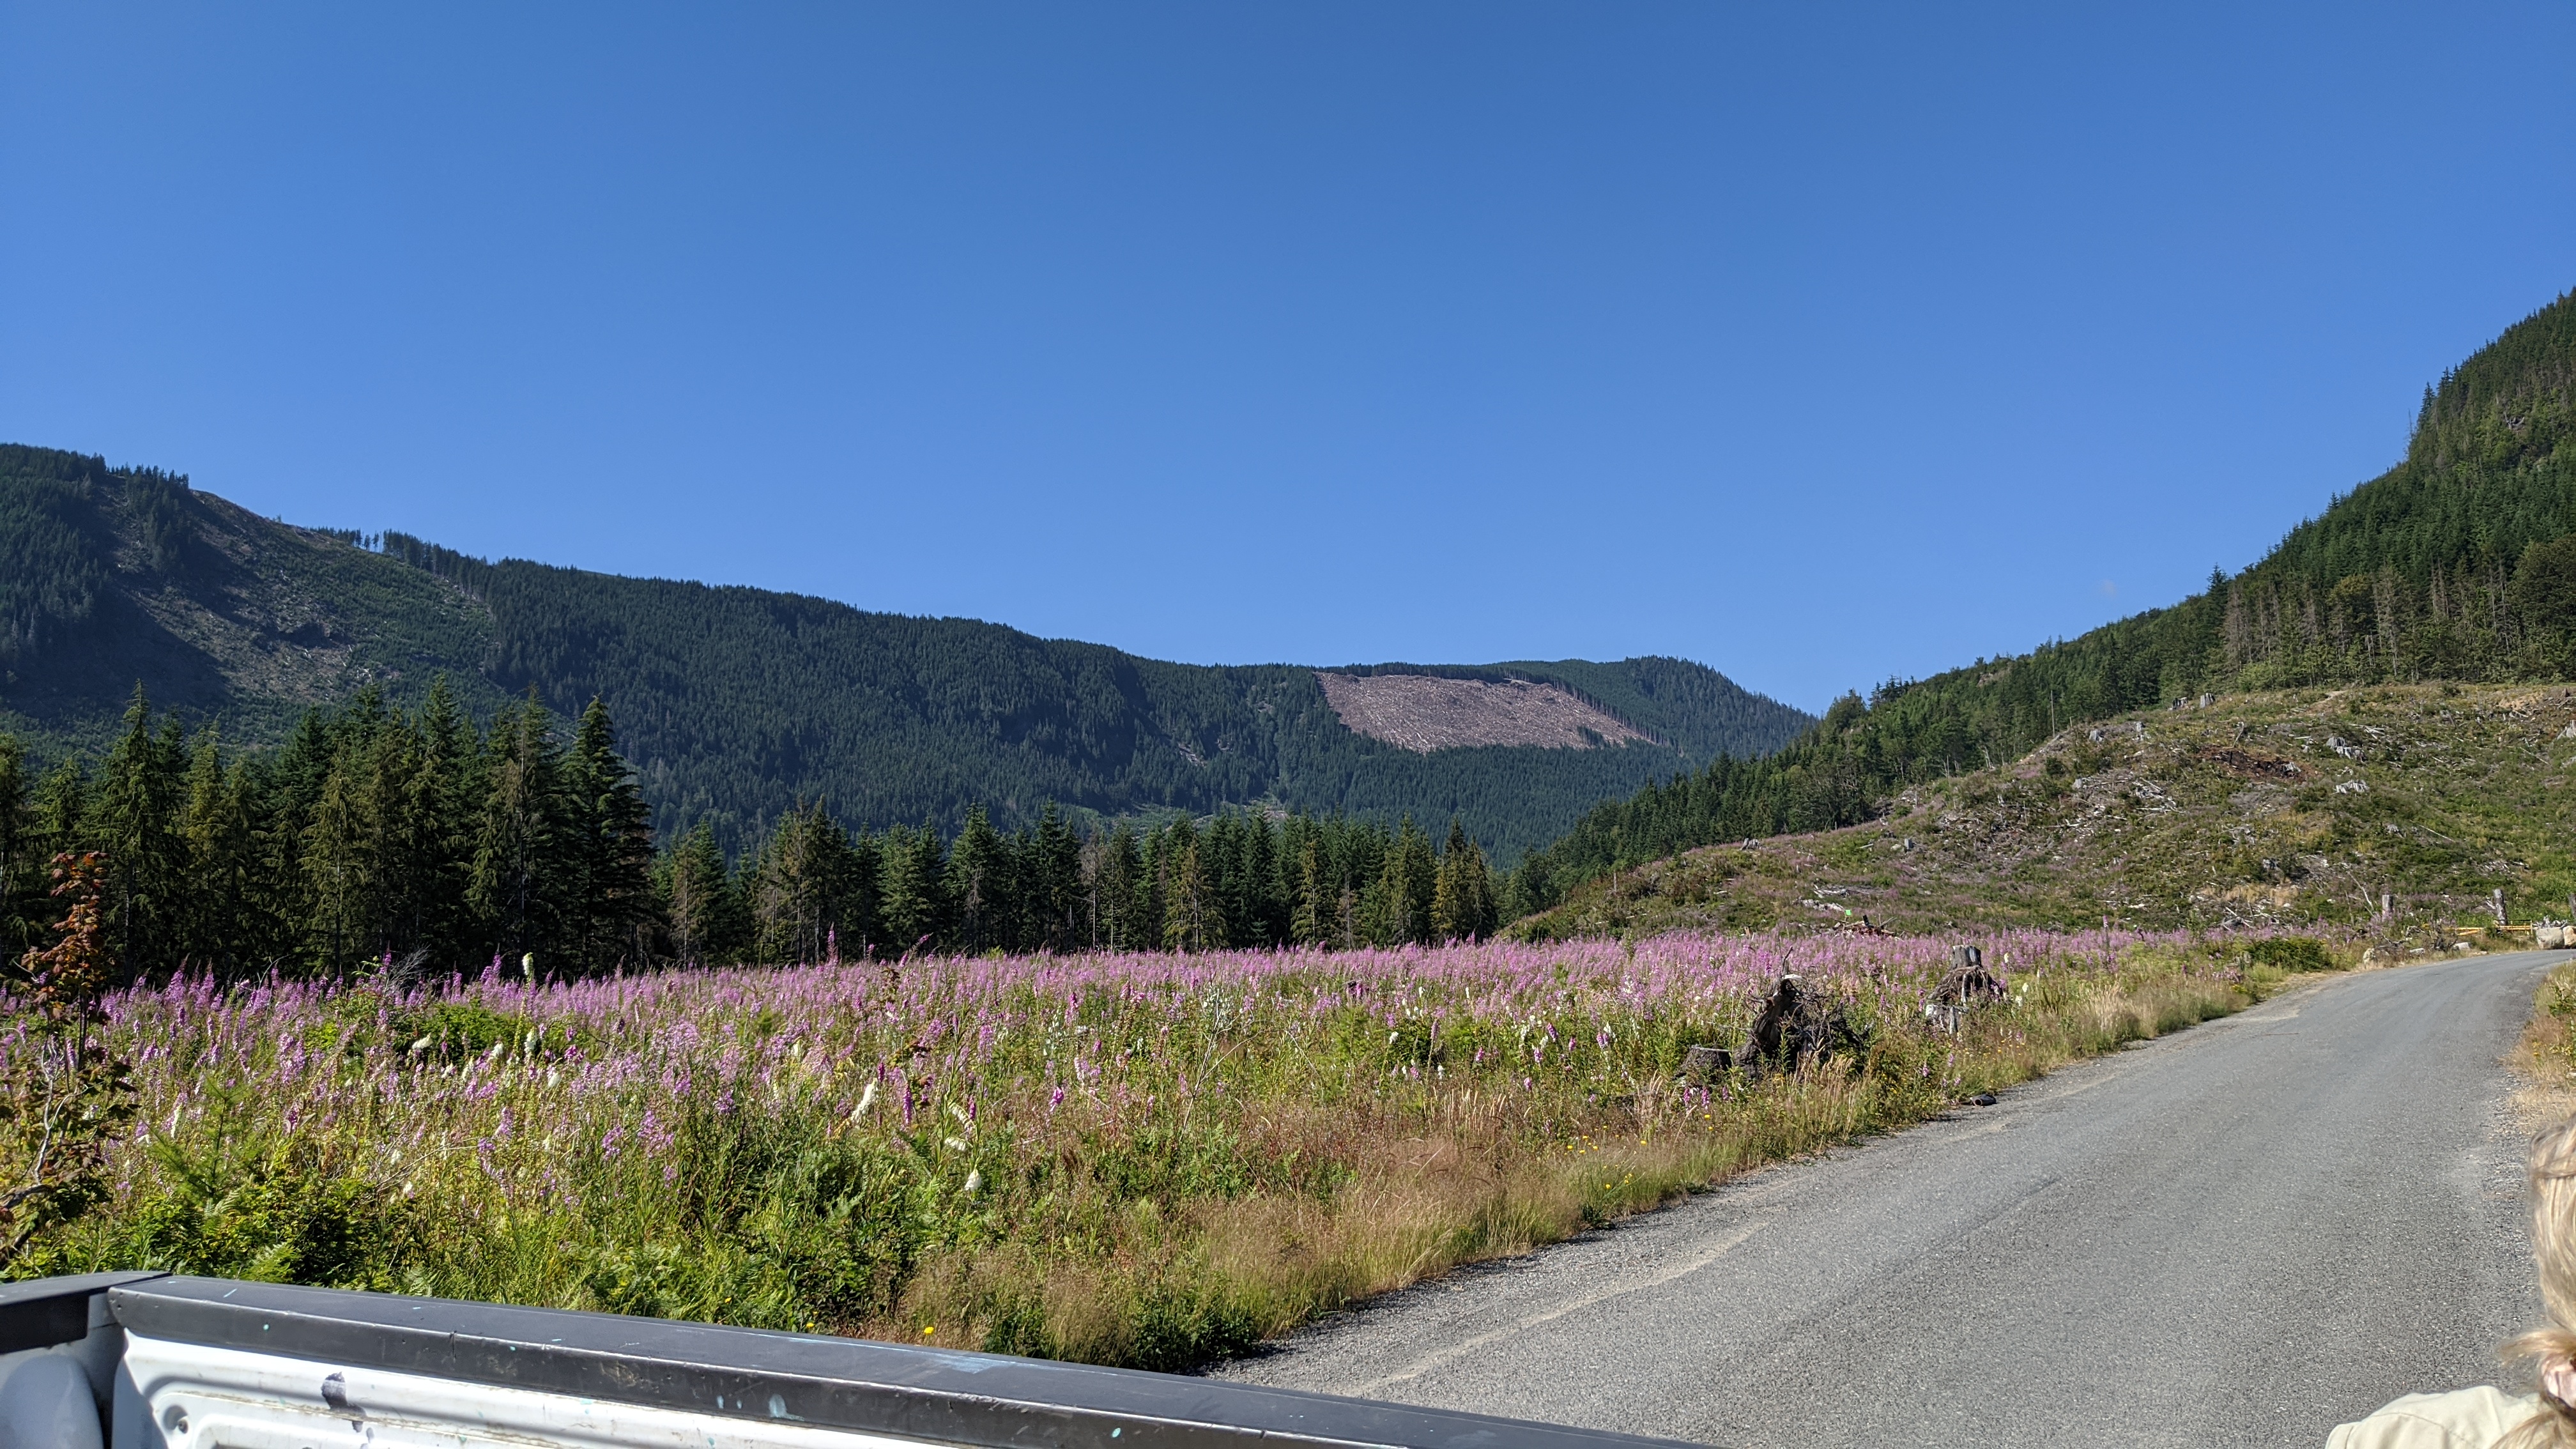
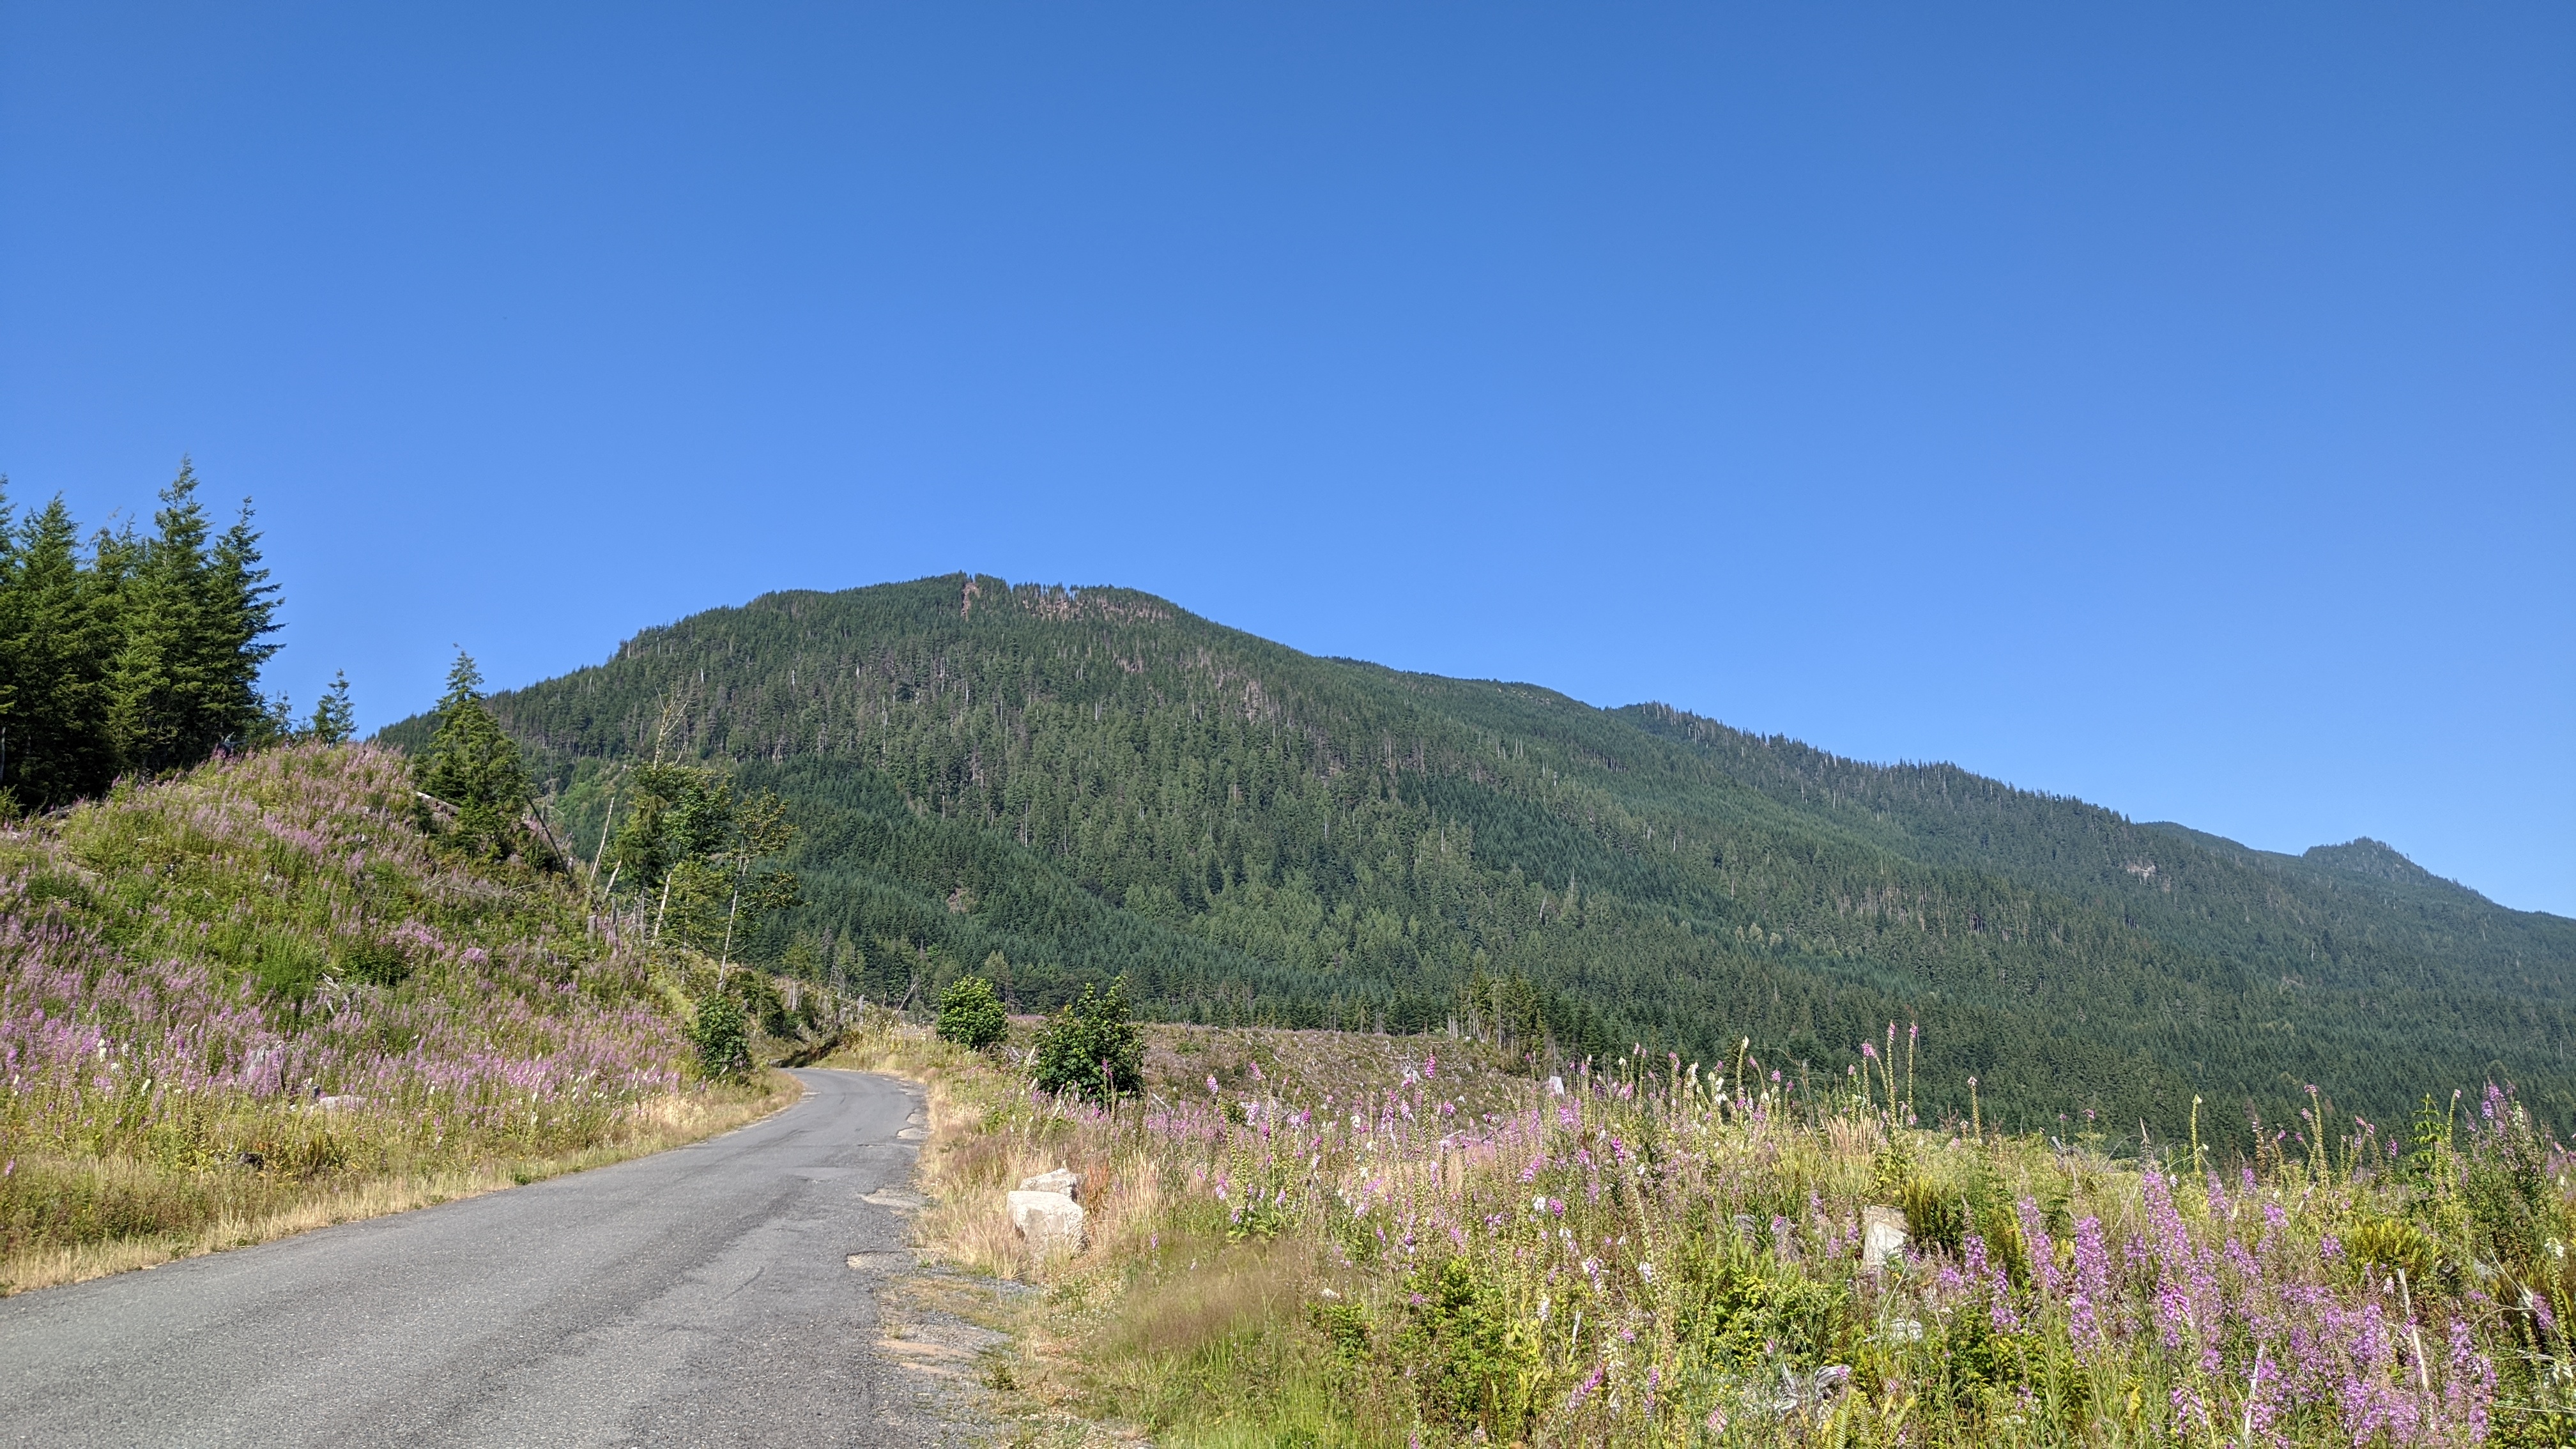
On the way to the sales is a DNR clearcut that has a good view of Mount Pilchuck on the right! The purple flower is foxglove, which grows like crazy in disturbed areas. It’s a lovely flower!
While we were stopped to smell the foxglove, we were able to compare the timber sales run by the Washington DNR and the Forest Service. Take a look:
That was pretty cool to see and it made me proud to be helping with the work that the Forest Service is doing up here to improve stands and habitat!
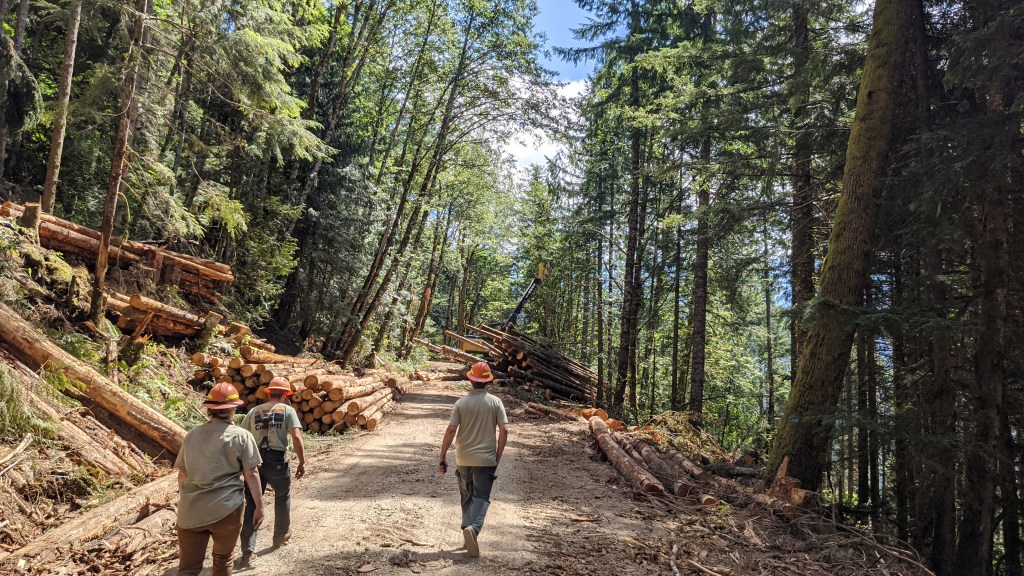
Checking the Loggers
While working with Sale Administration we also got to inspect log trucks, took a look at tags going on those trucks, and inspected their fire equipment. We also checked their work to make sure that they weren’t taking too much timber out of the forest as per the contract.
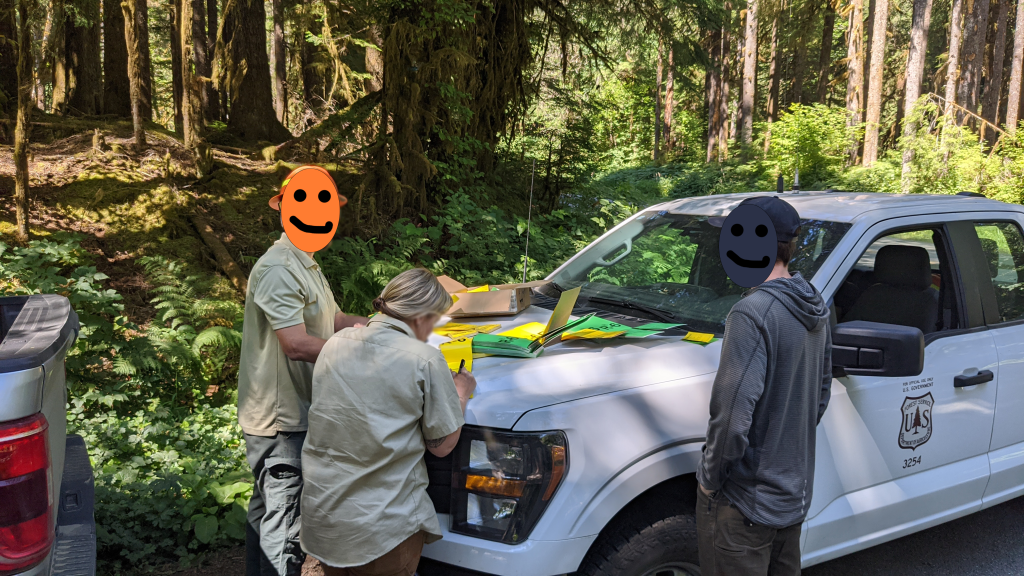
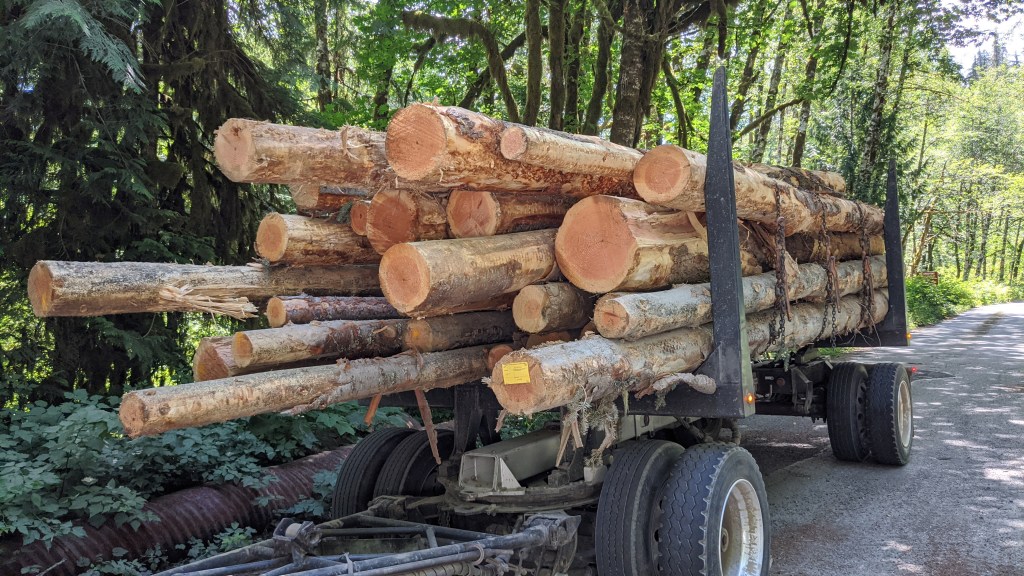
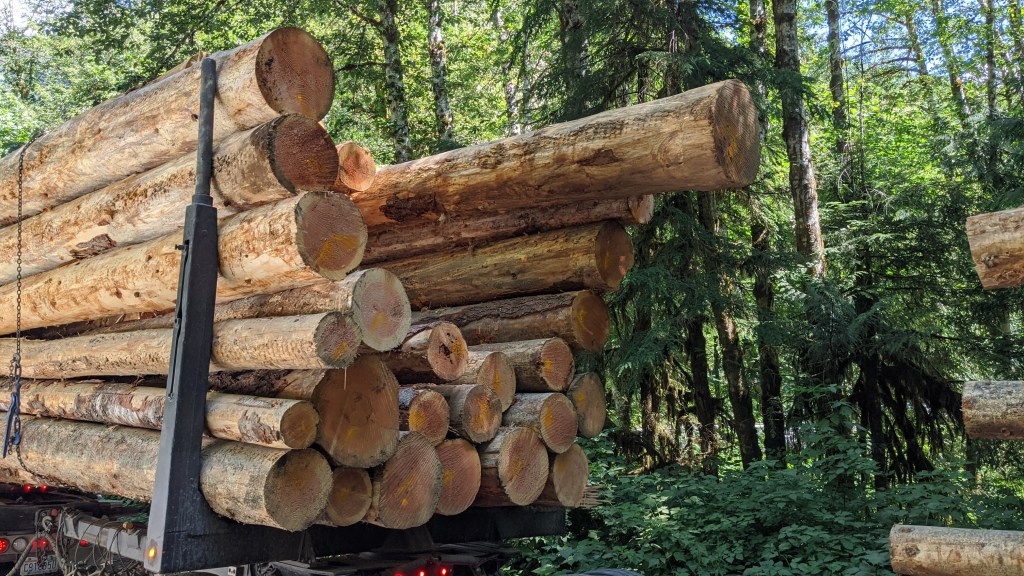
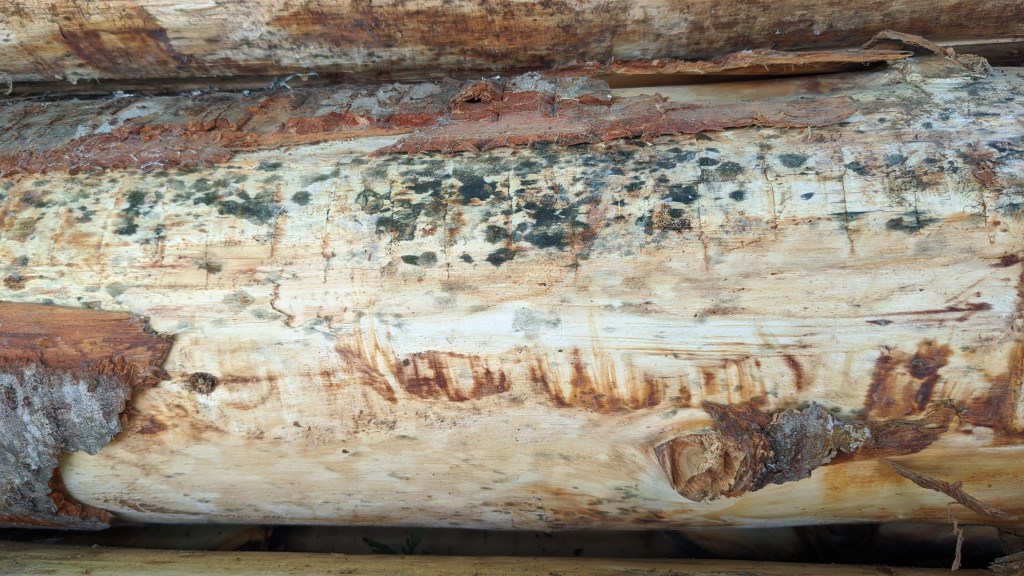
I thought it was pretty interesting to see timber on the log trucks and how it gets taken out of the woods. In the last photo you can see some mold already starting to develop on the logs as a result of them being in sapflow right now and not in the best condition to log. Which is a whole other can of worms and this blog is already long enough as it is for me to get into it. The thing to know though is that this is bad for the wood and the mill isn’t super happy with it.
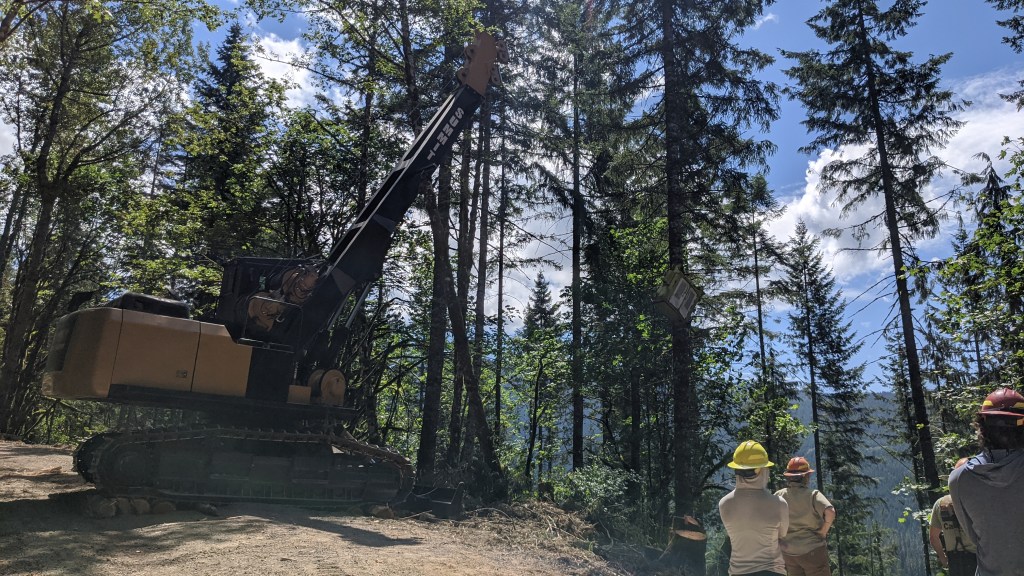
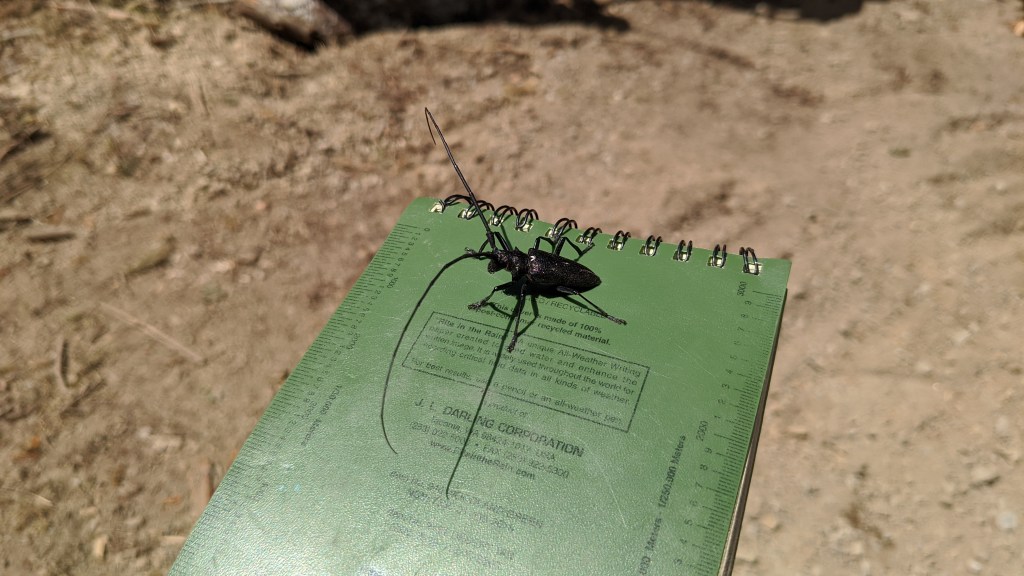
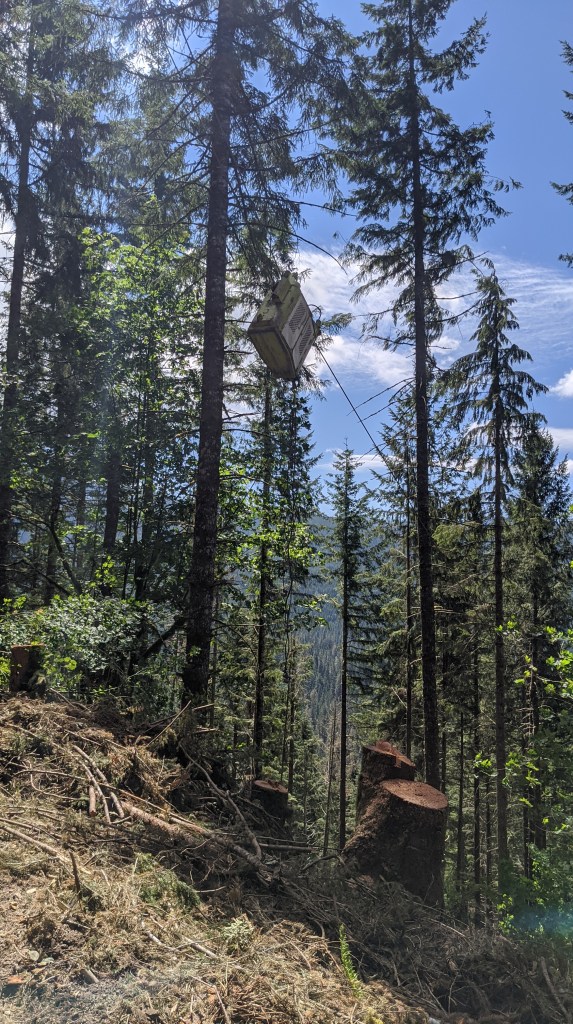
We also got to see a skyline cable unit on one of the sales in the area which was really interesting to see in person! In the third photo, a native longhorn beetle made a cameo.
What are we looking at here?
Skyline logging is a type of logging used in the Pacific Northwest and in areas with extremely steep slopes (above 35% sustained slopes) to get timber out of areas that normal logging machines aren’t able to.
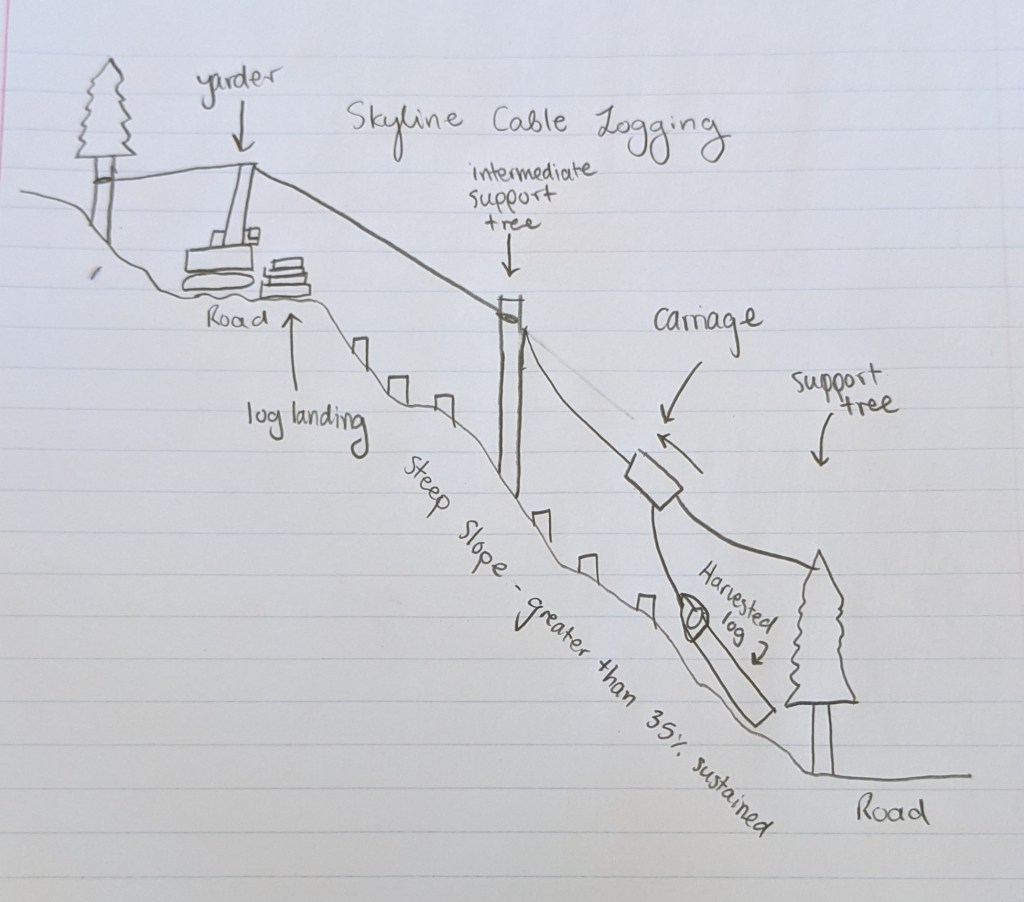
The idea is to set up a cable system that sits above the ground and that is able to pull logs from the bottom of the hill to the top (and sometimes from the top of the hill to the bottom) after being felled by a logger on the ground. In the first two photos above you can get a good view of the yarder and the landing setup, which is where the logs are temporarily stored before they can be put on a log truck. In the last photo you can see a good view of the carriage, which is used to carry the tethered logs to their destination. The muscle of the operation is the yarder, which actually moves the cable.
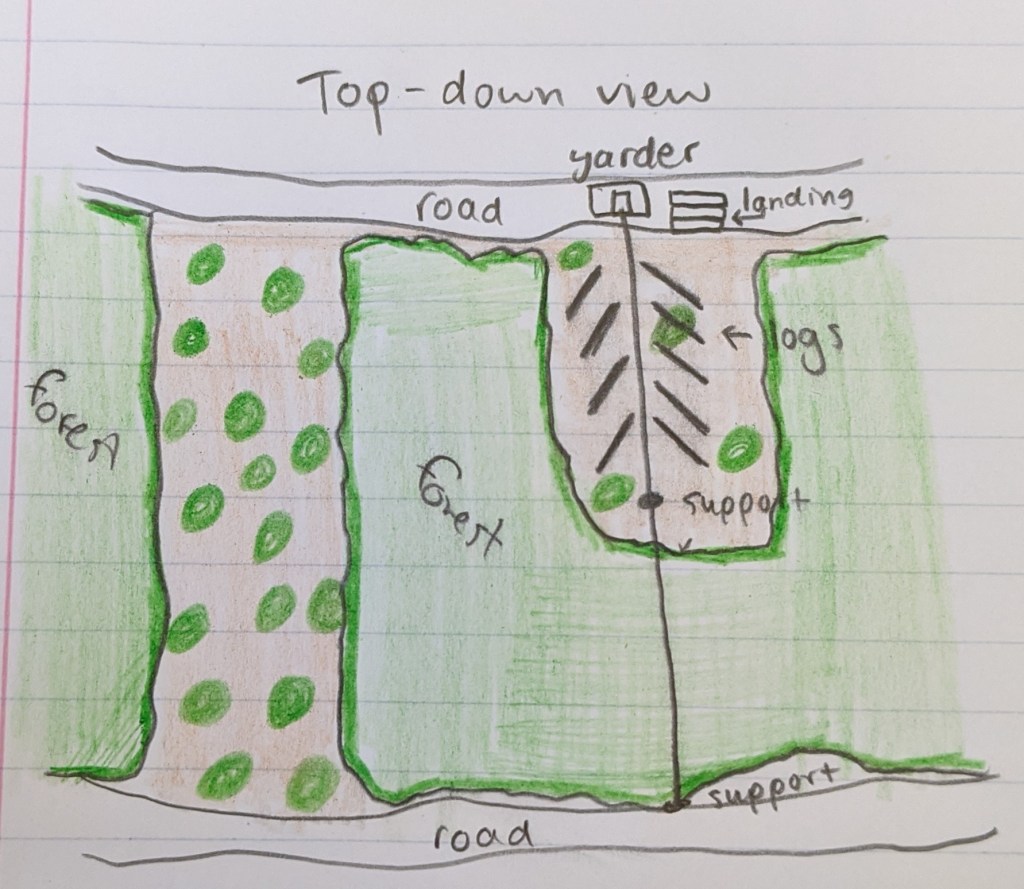
The diagram above is a top-down view of skyline logging. The loggers fell the trees in a herringbone pattern to be able to better put cables on the logs to take them up to the top of the landing. This diagram is also on a steep hill so imagine the bottom road being significantly lower than the top of the hill.
The results aren’t quite as drastic as what you see here and look more like the results I compared with the DNR. The loggers can move the yarder incrementally down the road to get trees laterally along the hill, which puts less stress on the yarder than trying to haul logs not immediately below it.
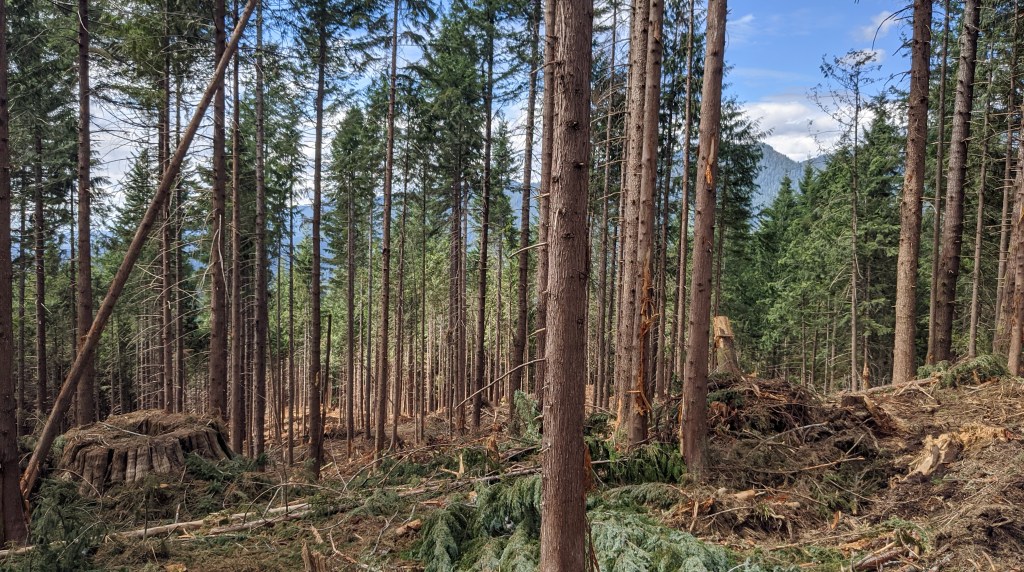
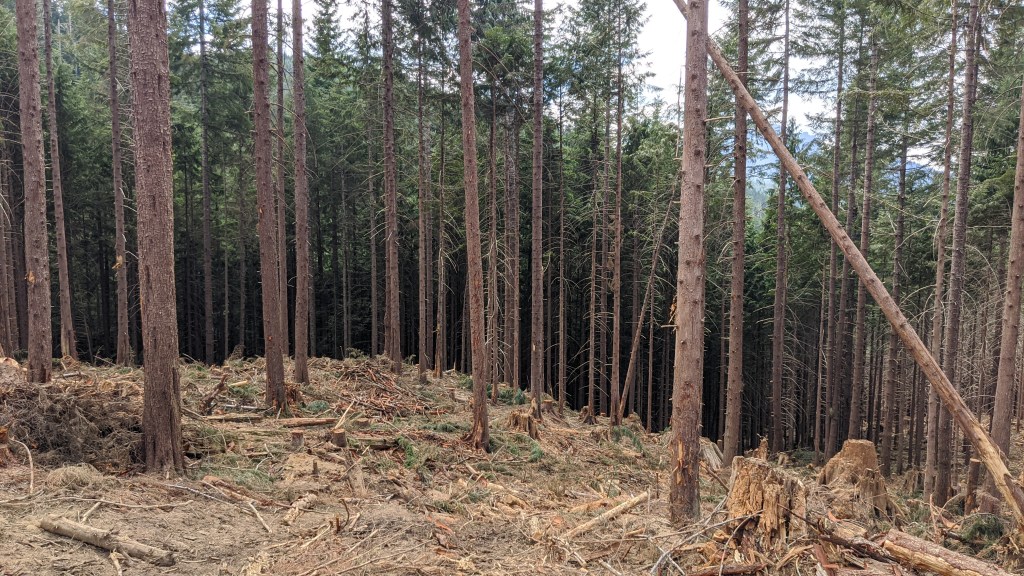
And the last thing we did was check the loggers to see how dense they left the forest and if they took out more trees than they are contractually allowed to. The loggers have a range of basal areas that they’re supposed to try to cut to, so we checked to make sure they were at that basal area. They were right on the line of being at the lower basal area, which was concerning since the contract states that they should try to average at a higher basal area. So although technically they were in the clear, they weren’t meeting the intended goals of the contract, which will need to be addressed later on.
For those who are curious, the units that were cut above were not done with skyline logging since the slopes were not steep enough to require it be done. Instead the loggers are using ground-based equipment to harvest the logs and put them on the truck. This has benefits like speed and efficiency, but also has drawbacks like ground impact and increased use of fossil fuels.
Mapping and Laying-Out a Timber Sale
I spent more time in Glacier, WA again these past few weeks helping with layout on the Kidney Stone sale. You can read more about what I got up to in my previous post!
This time I got to paint some trees and gps where those trees were to get an area estimate for the various units of the sale.
For two days I also walked around with a tablet and GPS unit taking survey-grade points to collect information about where exactly (accurate to within a meter) and how large the units of the sale are.
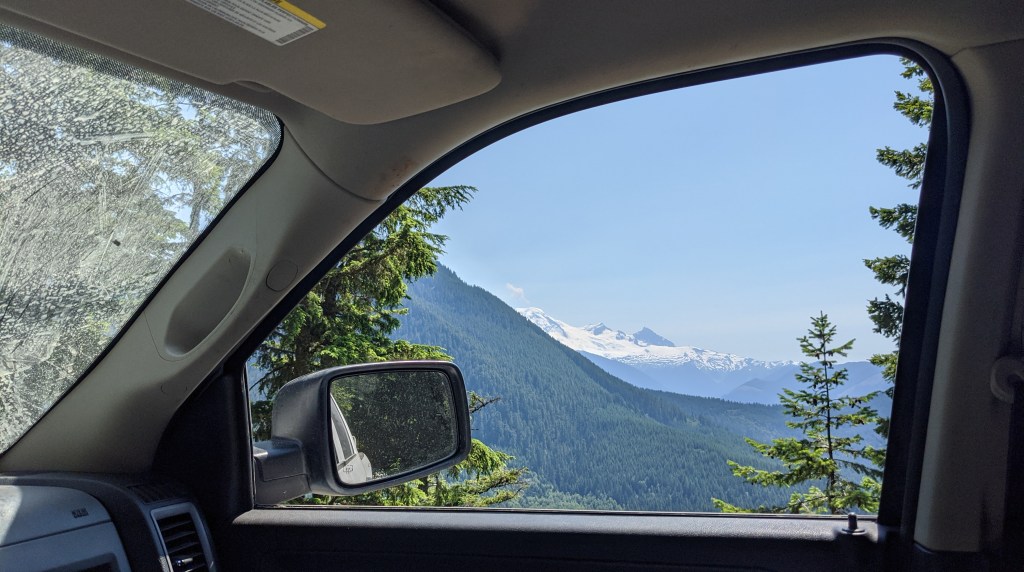
I also got some good views of Mount Baker and had great food at Graham’s and Chair 9.
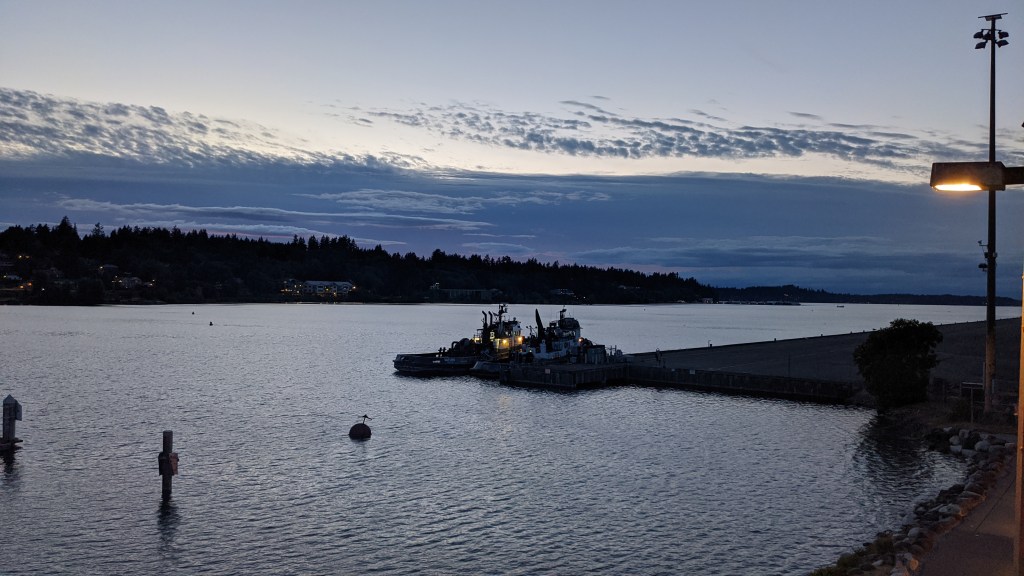
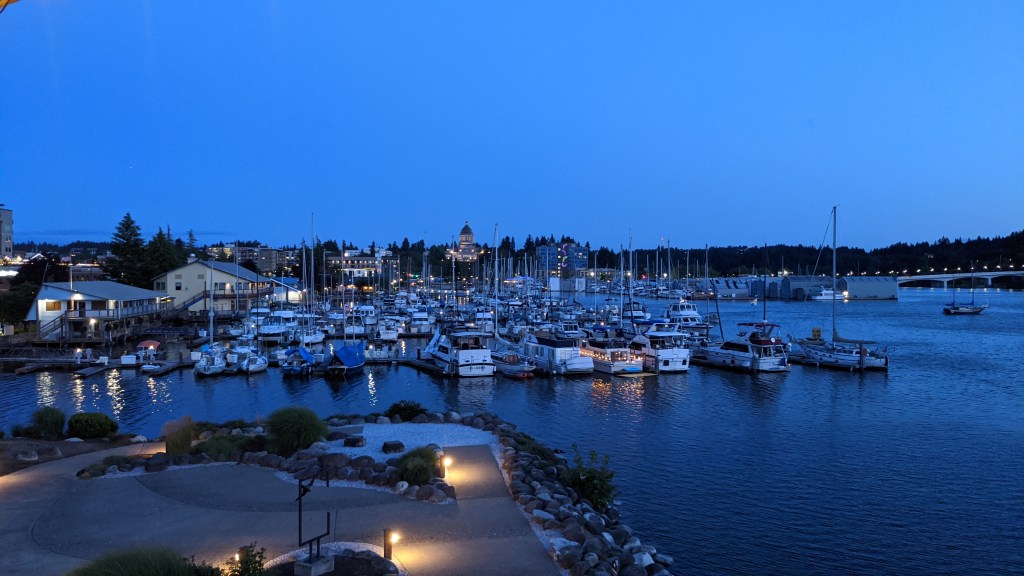
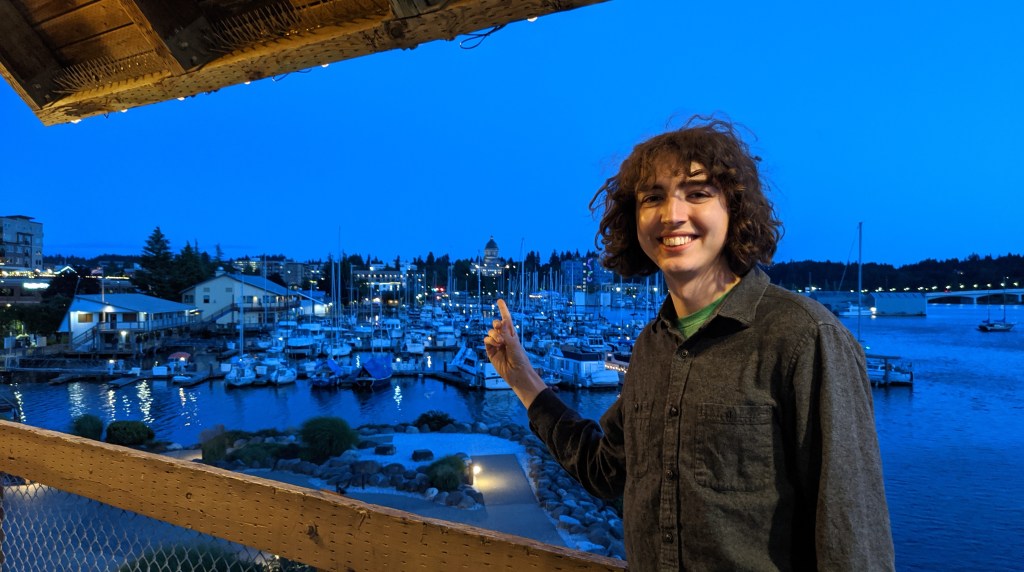
Olympia
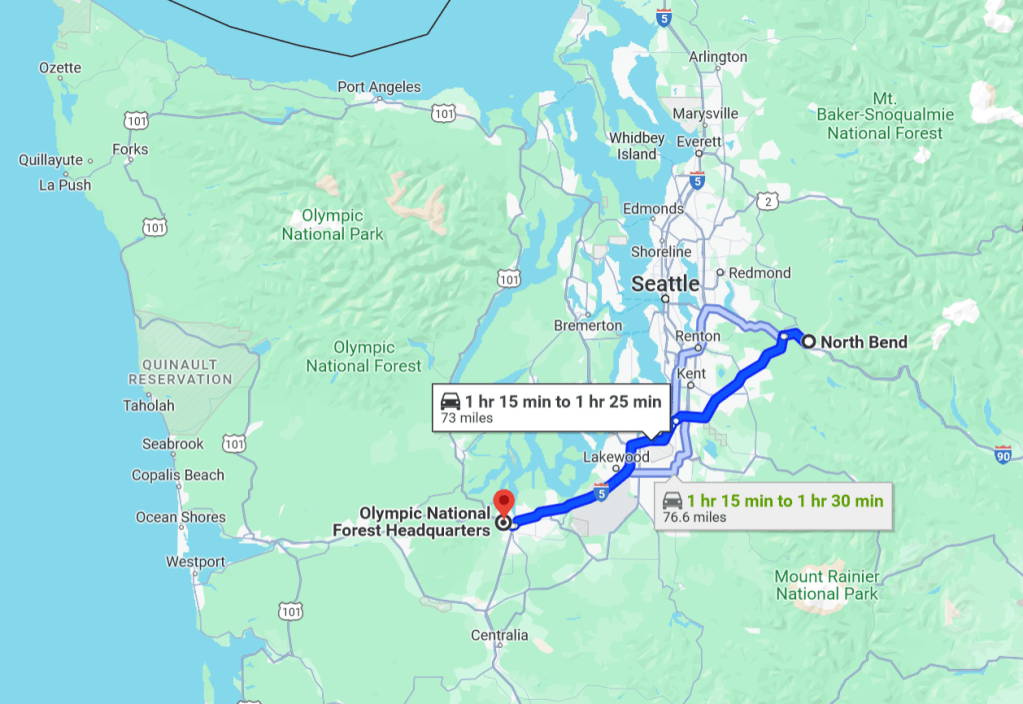
We also spent some time in the state capitol, Olympia, this week to help the Olympic National Forest fix some of their timber cruising plots from a long time ago.
We stayed in a hotel Wednesday night and got to work all day Thursday
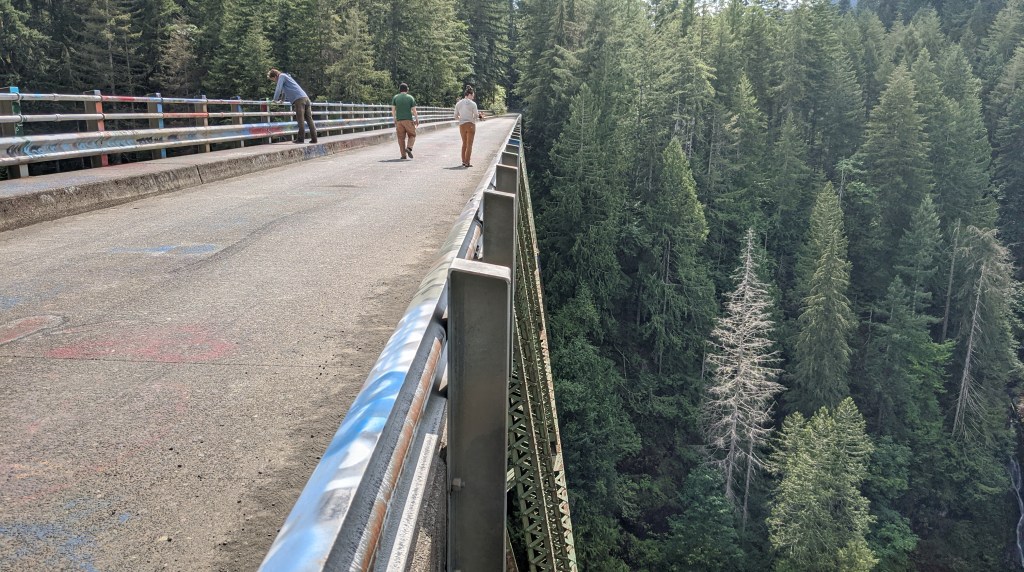
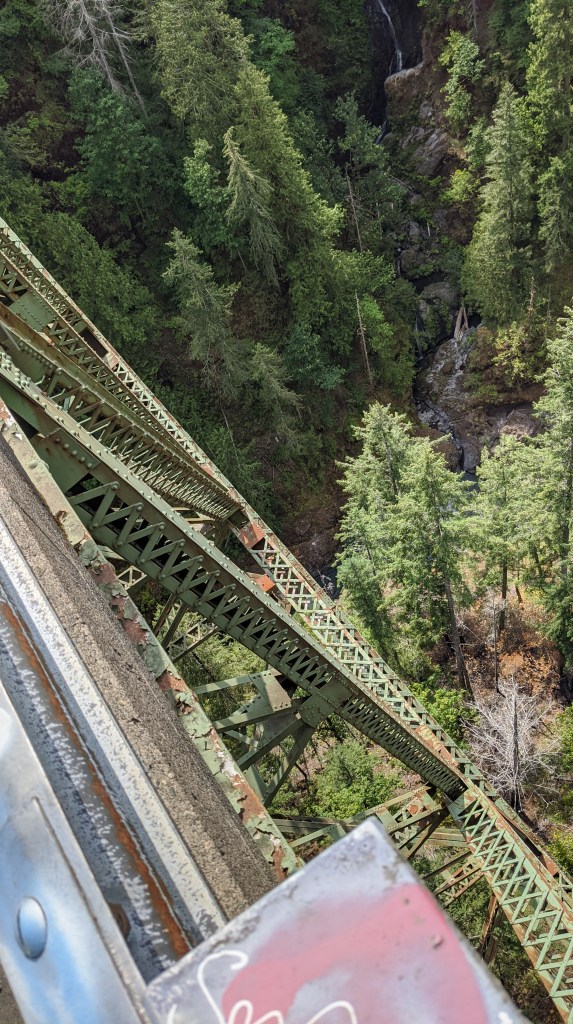
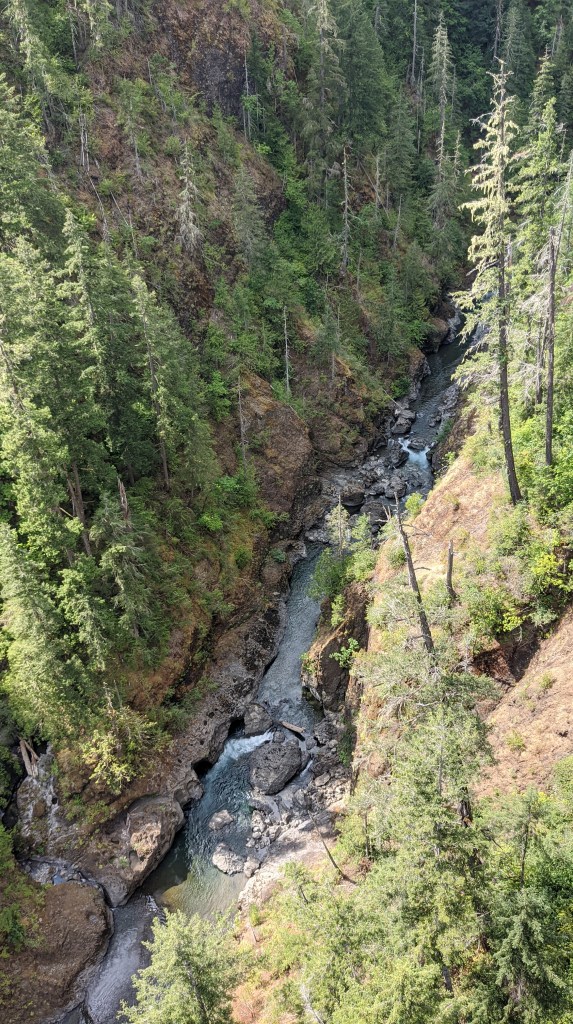
I don’t have a ton of photos of us actually cruising since we were just measuring trees all day, but we did get to see a cool iron bridge from the 1920s
Afterwards we got ice cream at Olympic Mountain Ice Cream and unknowingly went to their production facility where they had dozens of free samples available!
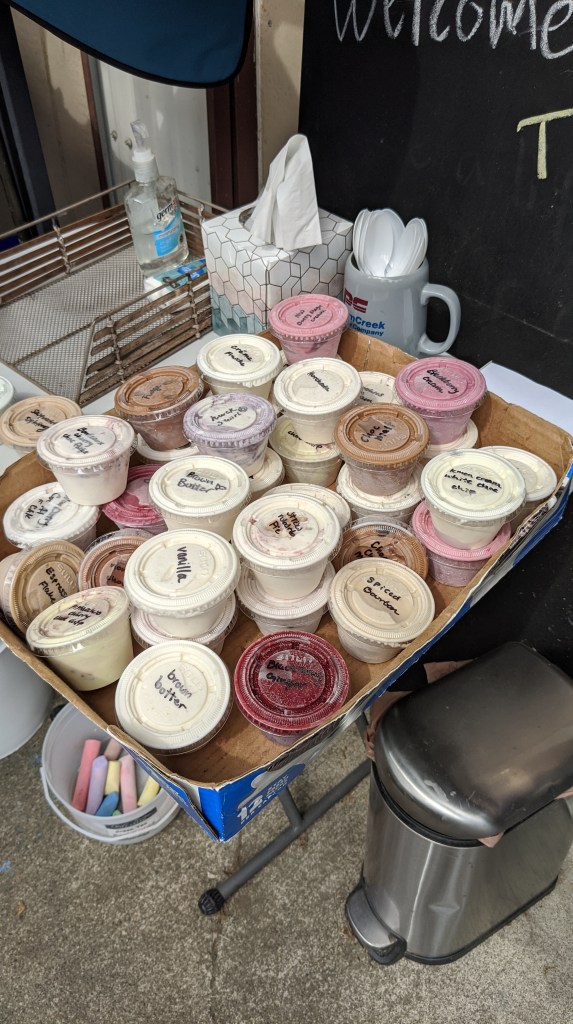
They said they had over 300 flavors to choose from and you could order pints directly from them for $4 for one or two for $6. We honestly thought that it was going to be an ice cream shop when we got the recommendation from one of the timber workers in Olympia, but we were definitely surprised at the free ice cream and the quality of the flavors. I tried huckleberry swirl, lemon sorbet, and horchata. My coworkers got vanilla honeycomb, matcha lavender, Bordeaux cherry, and much more that I can’t remember. They were super nice and the ice cream was all delicious and a great end to the work week!
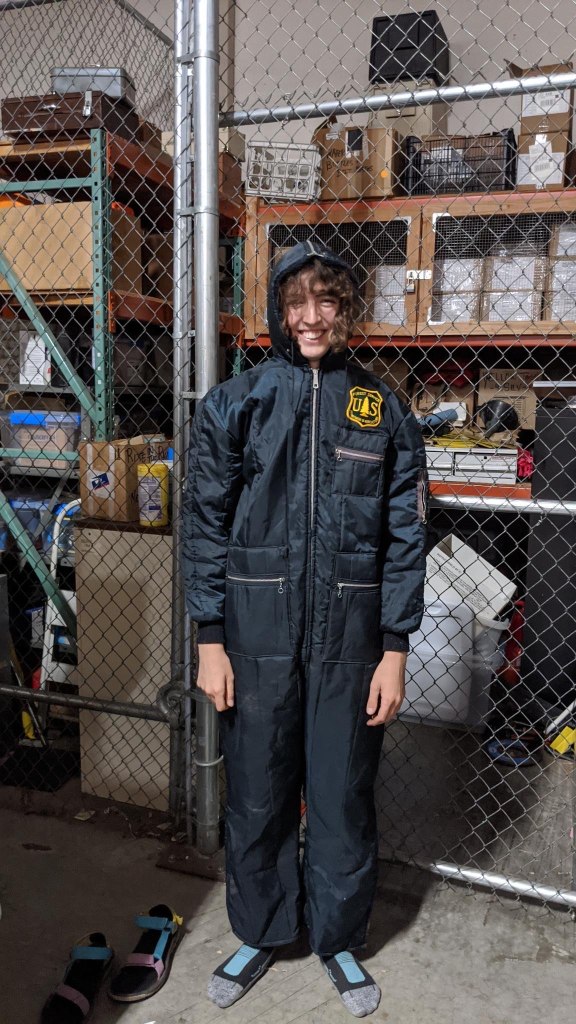
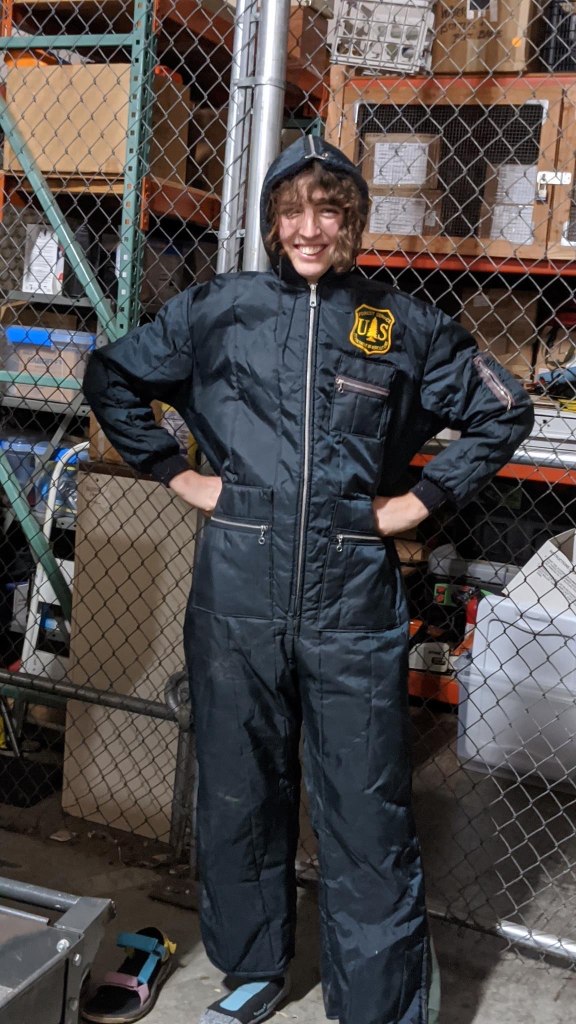
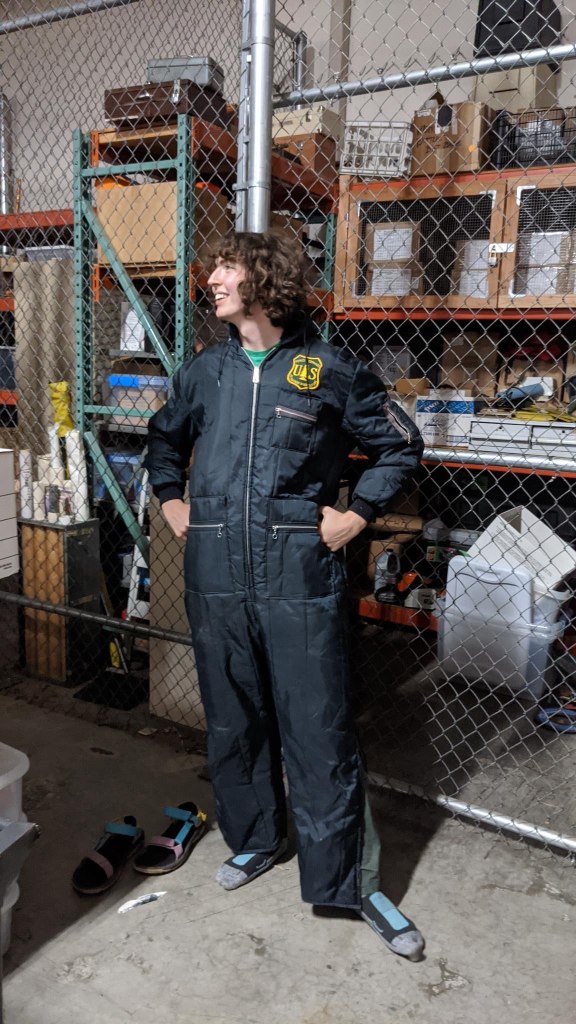
To put a bow on everything, I even got to keep this cool snow suit from the Olympic National Forest that they’ve been trying to get rid of for forever
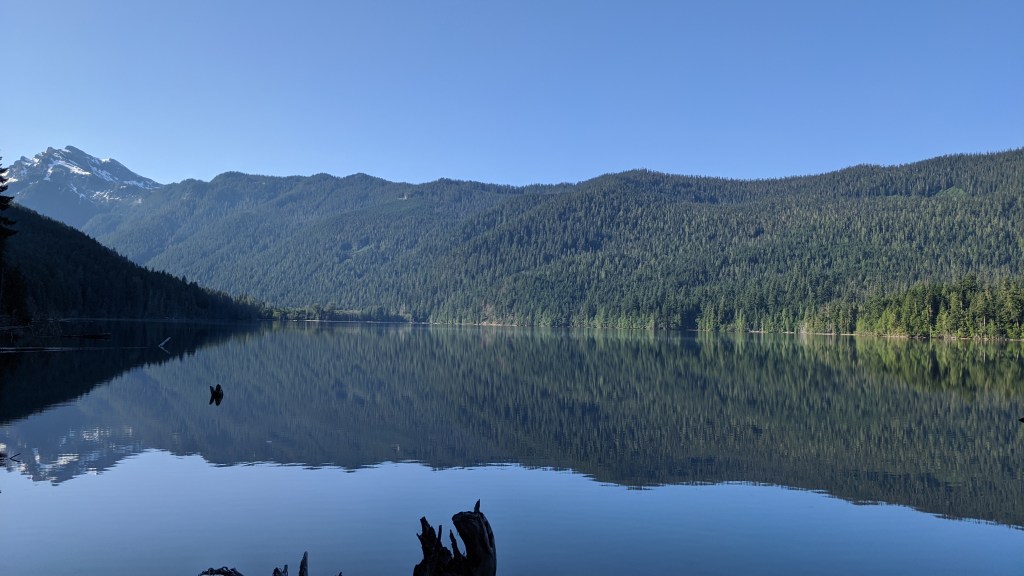
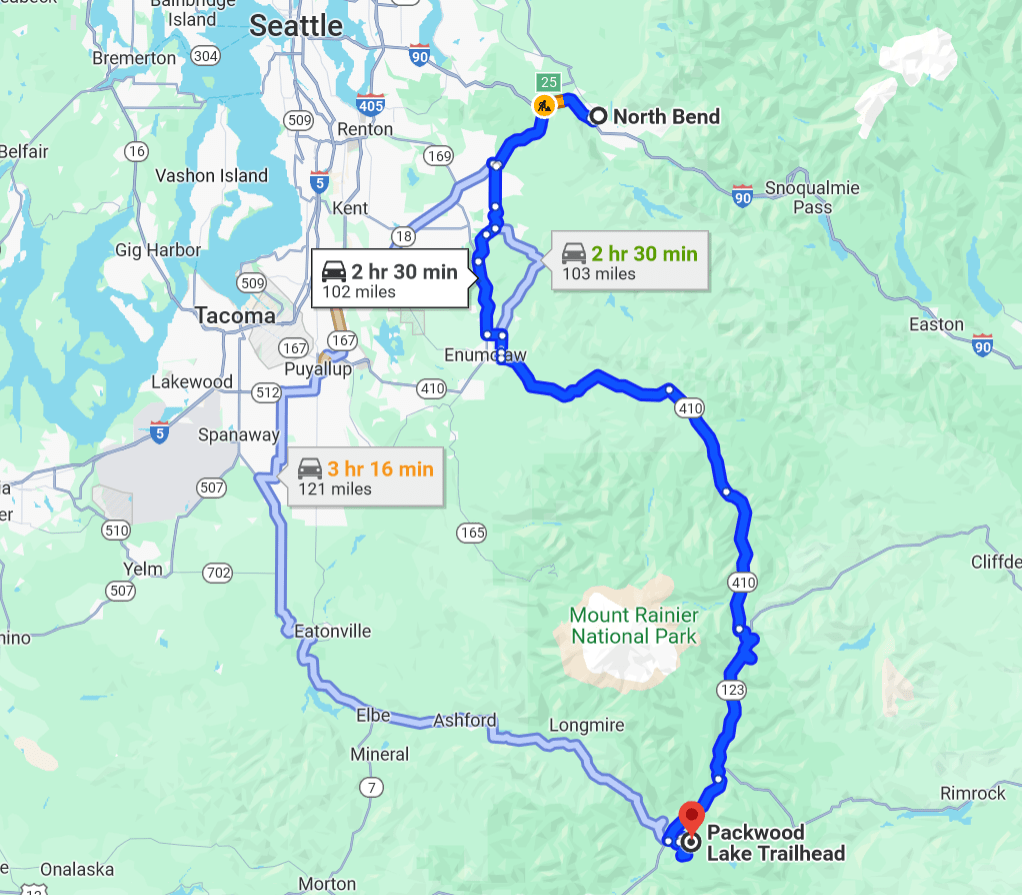
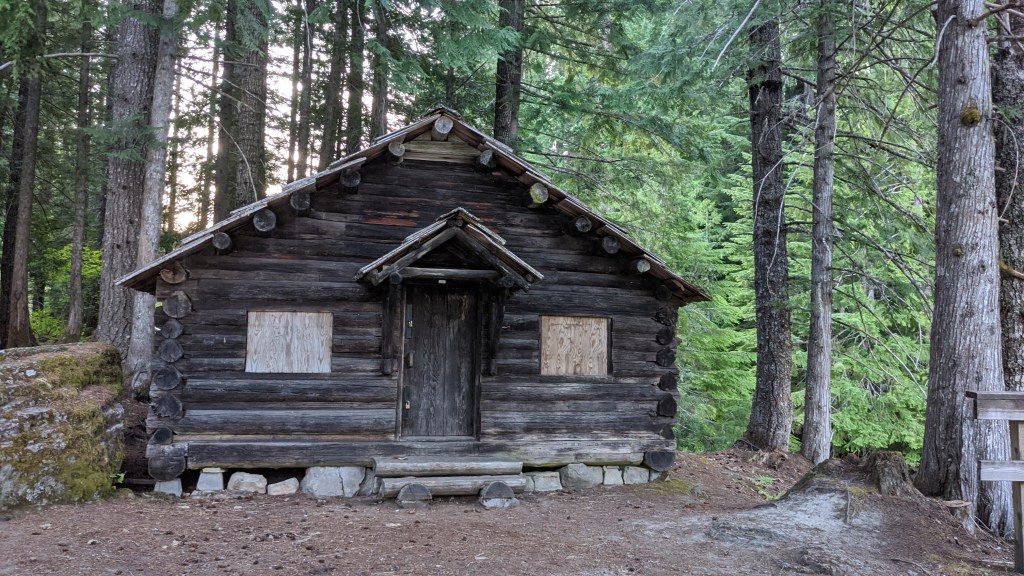
Visiting Packwood Lake
This was definitely the highlight of the last few weeks for me!
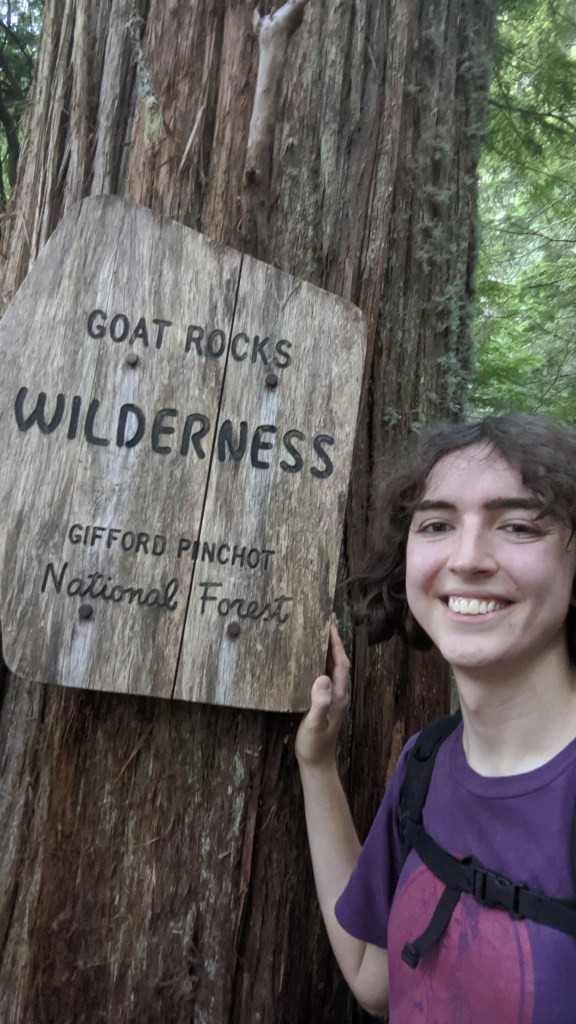
My coworker Jean invited me and some of her friends to go on a multi-day trip to Packwood Lake to hang out and go swimming. It was super fun and very scenic, and I got to make some cool friends!
We arrived in the evening on a Friday and left on a Sunday, which was a fantastic way to spend the weekend.
I did some day hiking on Saturday with one of Jean’s friends, and we even swam in the lake. It was cold! I packed some tasty food as well (notably a burrito with refried beans, avocado, and bell pepper. I’m still thinking about how good that burrito was weeks later.
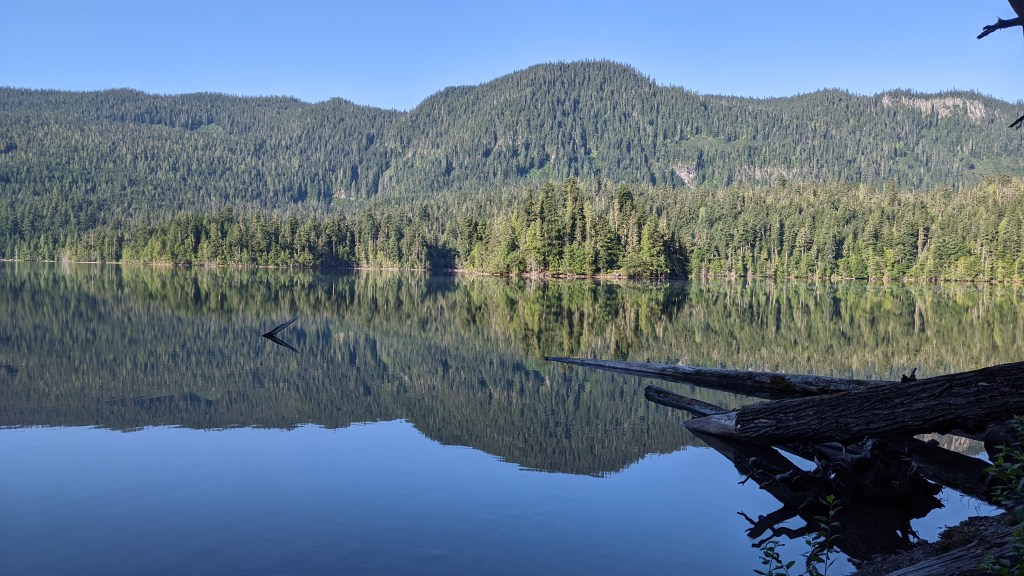

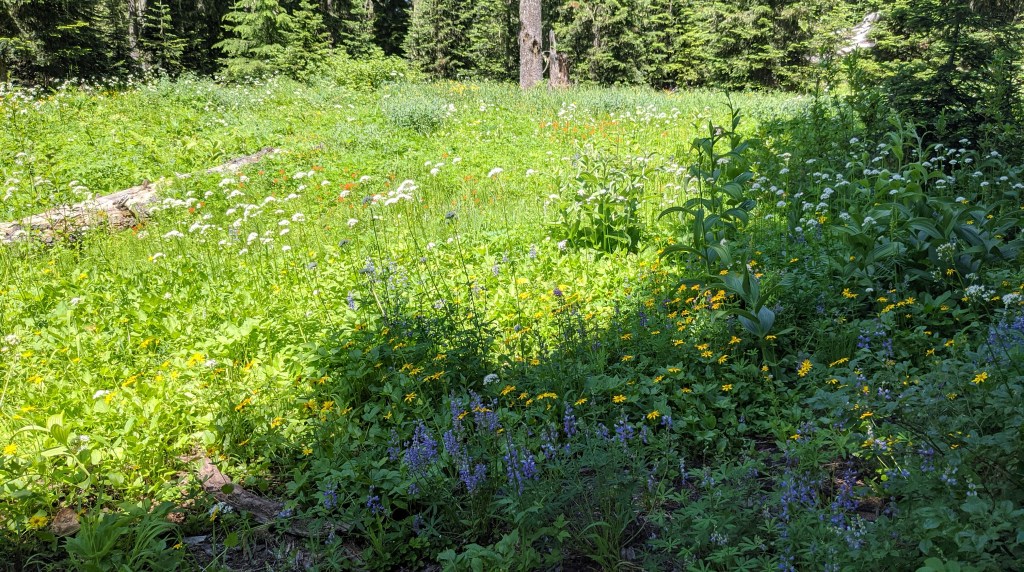
The Saturday day hike I did was super fun, but also steep! We tried to hike to a lake called lost lake. It was a few miles away from where we camped, but we didn’t realize the elevation gain on the trail and we got worn out and decided to turn around near mosquito lake (there’s a lot of those in Washington!). Luckily there were plenty of wildflowers in bloom and we even got a good view of Mosquito Lake itself!
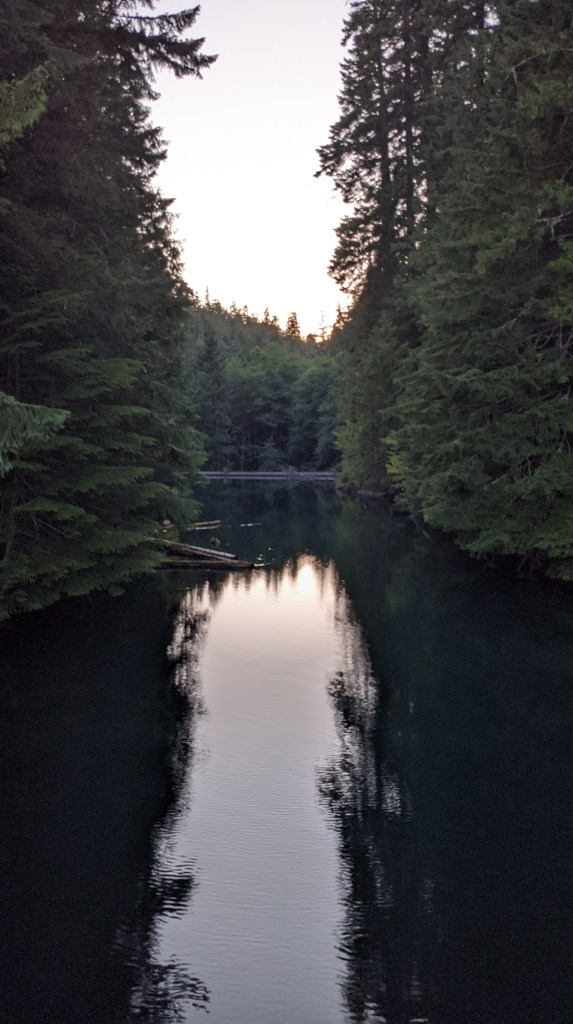
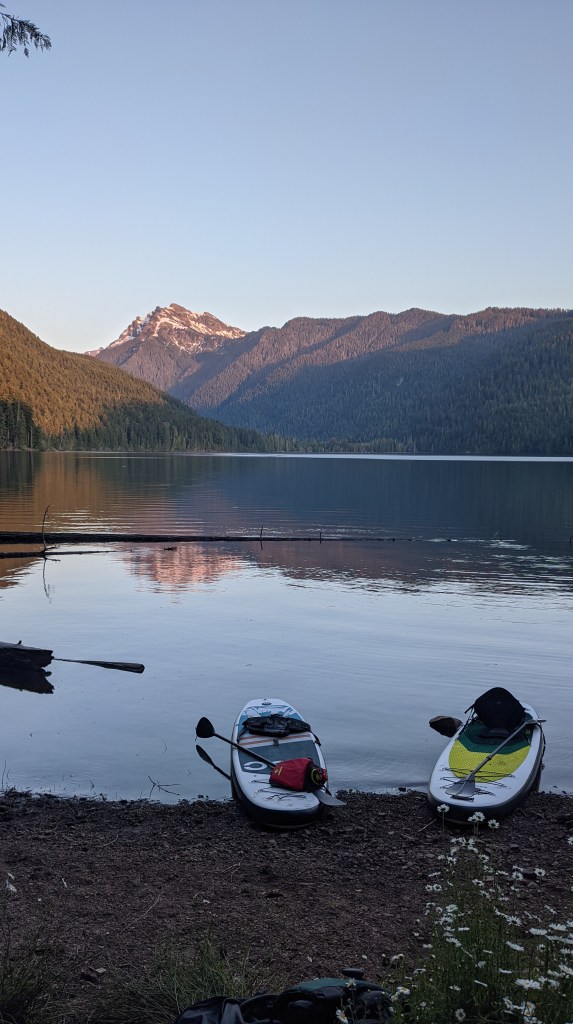
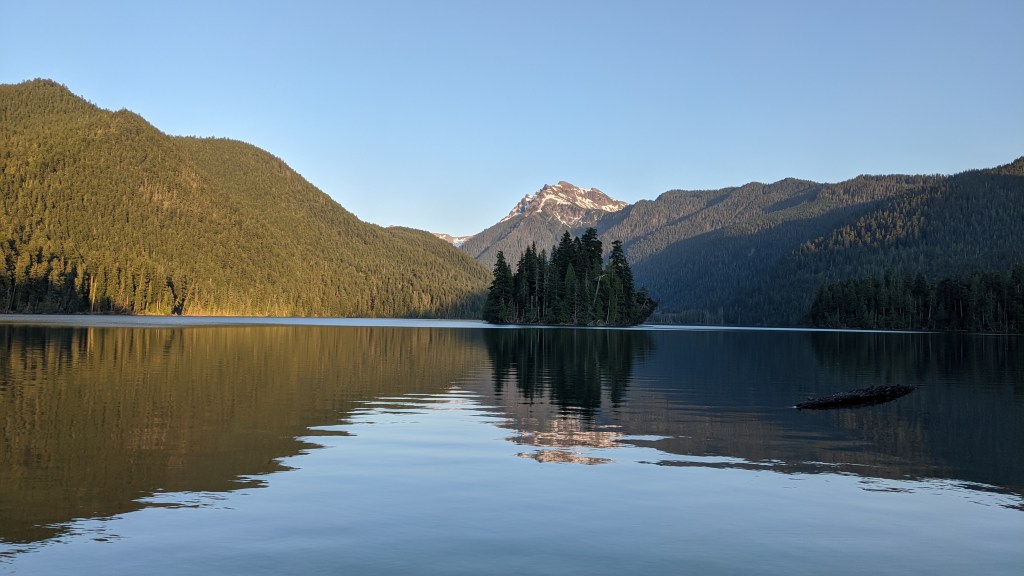
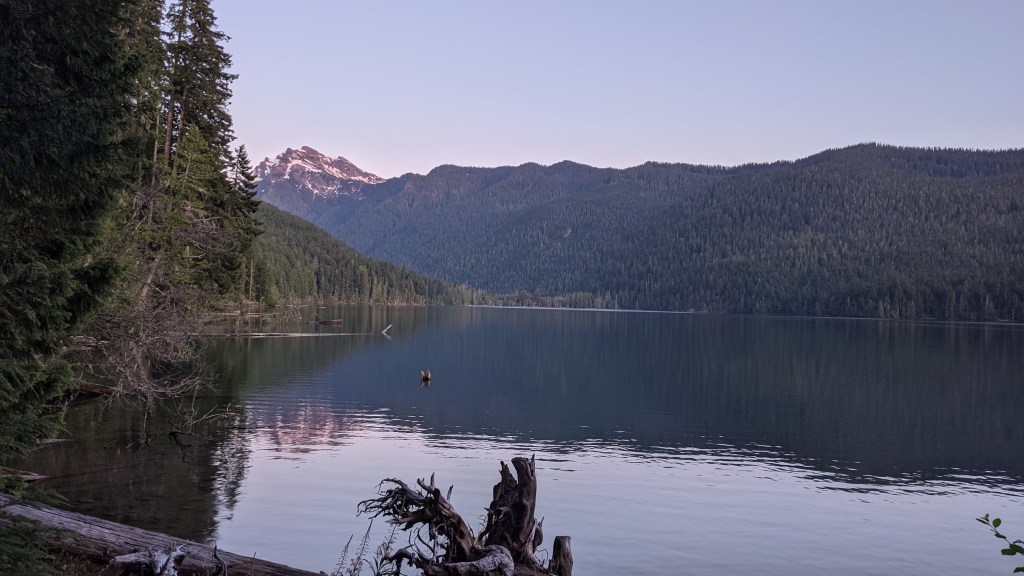
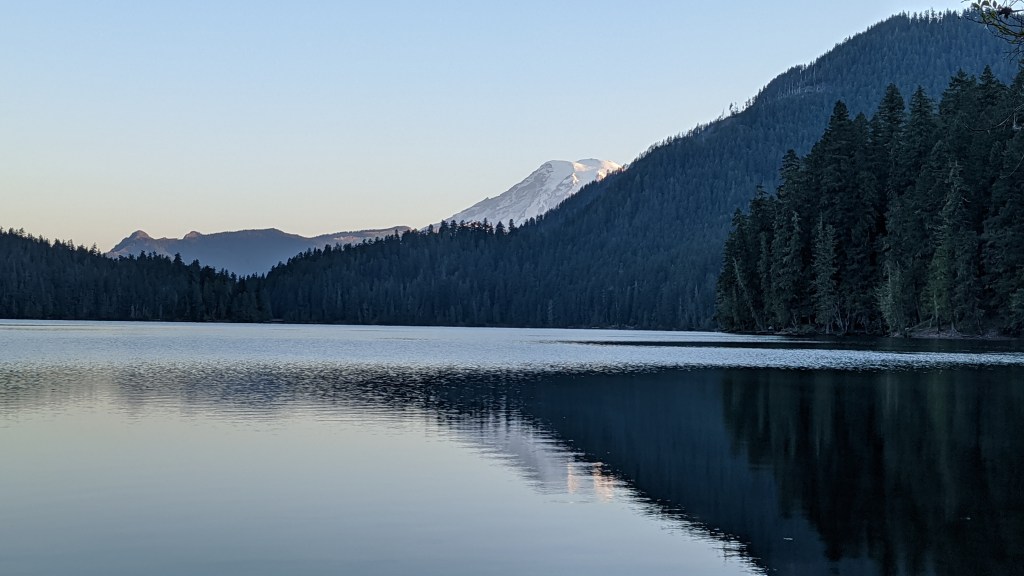
The sunsets and sunrises were really pretty and I felt inspired to climb the mountain that’s at the back of the lake, Johnson Peak (which there are also multiple of in Washington).
I got up early on Sunday to get a photo from the other side of the lake with a good view of Mount Rainier. I also learned that Washingtonians say (RAIN-eer) not (Ruh-neer) like I say it. But I will stand my ground for my eastern readers and I won’t succumb to the peer pressure!
Dancing and Festivals
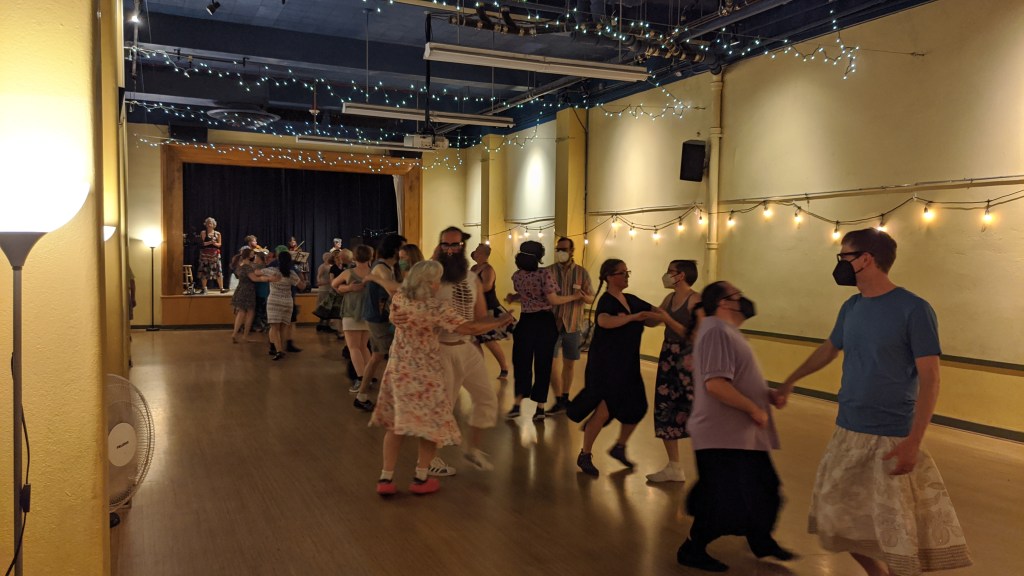
I finally went to an Emerald City contra dance night in Seattle and it was super awesome! I think I found a new interest this year and I’m super happy about it. The people were all very nice and willing to teach me, and the music was fantastic.
This particular dance had a lower turnout because Chappell Roan was playing at the Capitol Hill Block Party on the other side of town.
It was very fun and I wish I had more time to go this summer! I plan to go to a few more before I leave, which is nice.
Afterwards I got invited to the after party, which was just a bunch of folks hanging out in a house. It was fun and it was good to be included! I made some friends that night which was really nice.
On Monday this week I went to another contra dance in Seattle with my bunk mates to show them what I got up to over the weekend and they absolutely loved it!
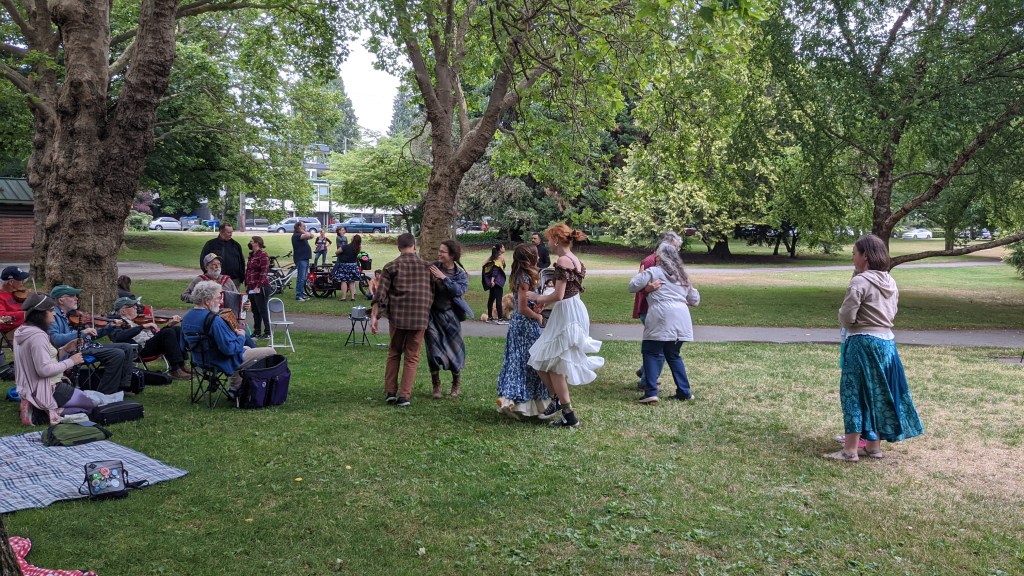
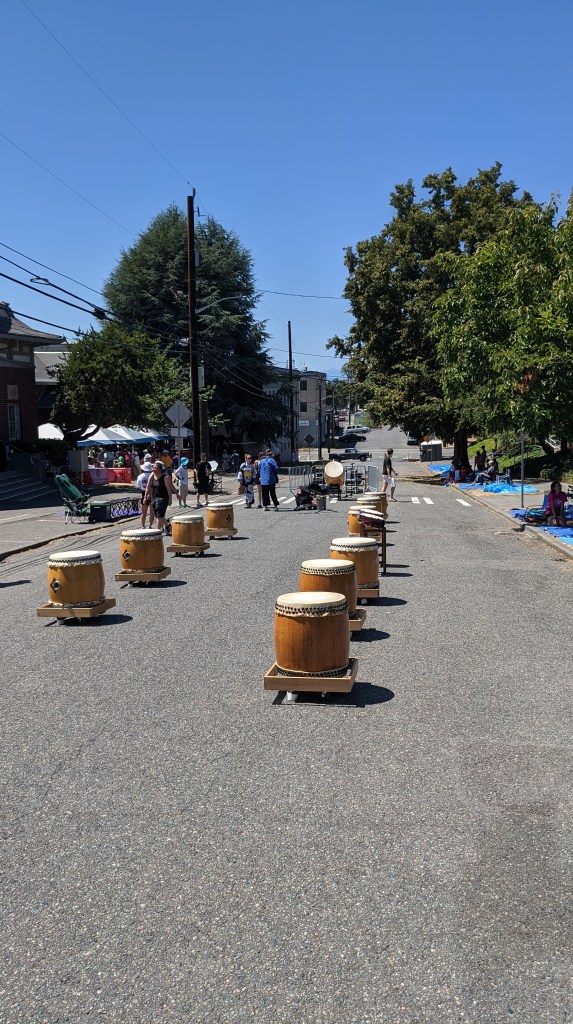
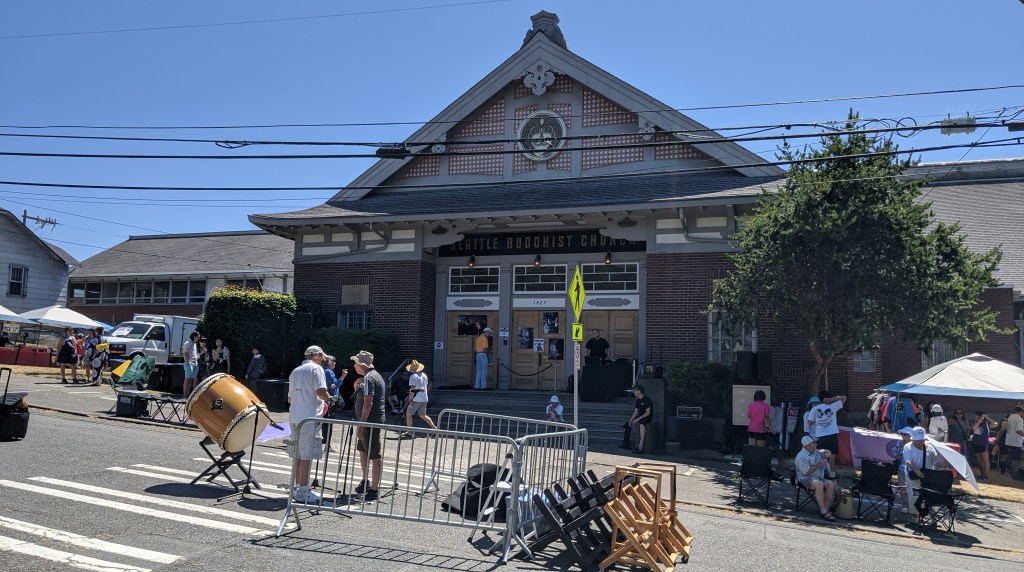
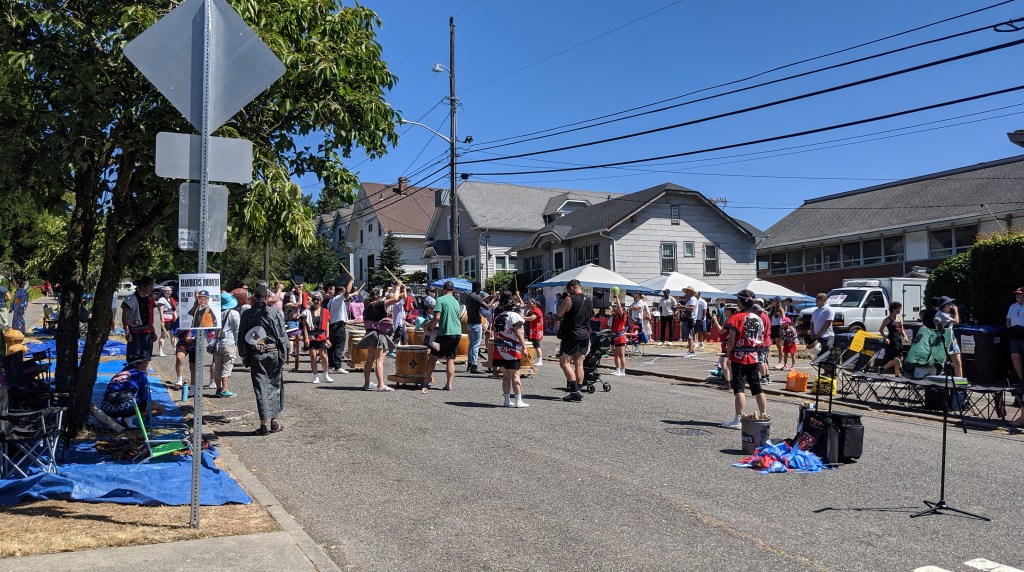
I also went and helped with the Seattle Go Center again at a Buddhist festival put on by a Buddhist Church in Seattle. The festival is called Bon Odori and was super fun! I just went for one day, but I had a great time. There was dancing and drums and some really good food. I brought my own to save money, but the festival had a nice hospitality table and the people I taught Go to were all very very nice.
That’s it for this week! I hope you enjoyed reading.
As of writing this I only have 3 full weeks left in Washington before I leave on the 16th of August. Crazy how time flies! Be on the lookout for at least one more normal post, then I’ll probably do a roadtrip post documenting my journey back east.
Thanks for reading!

Leave a reply to johnna w. Cancel reply